| Table of Contents |
|---|
Before you start
To be able to import data from Jira into Power BI, your Jira administrator should grant you permission to create, edit, watch, and export connectors.
If you don't have access to these actions, please contact your Jira Administrator to grant Power BI Connector for Jira permissions first. Jira Administrators can always access application configurations.
How to create a data source in Jira?
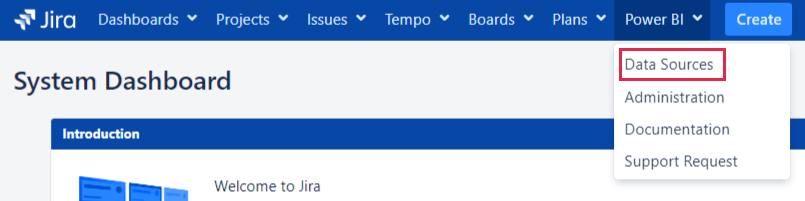
Step 1. Click Power BI Tab on the Jira’s main menu. Then choose Data Sources.
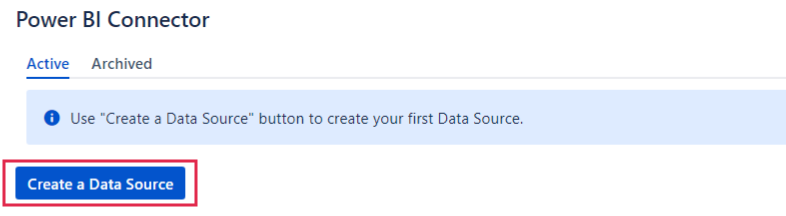
Step 2. On the opened page, select Create a Data Source.
Below you can find a description of the fields, buttons, and settings of data source creating page:
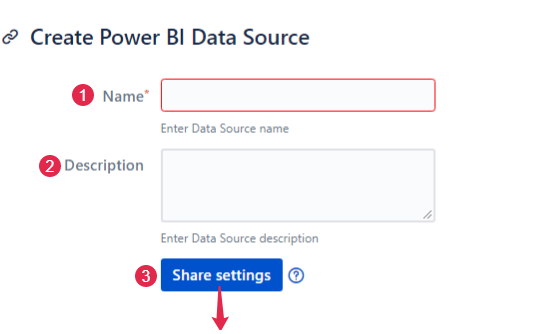
Title section
1. Name -Enter data source name.
2. Description - Enter data source description.
3. Share settings - You may share this data source with users or groups of users who have permission to use the application.
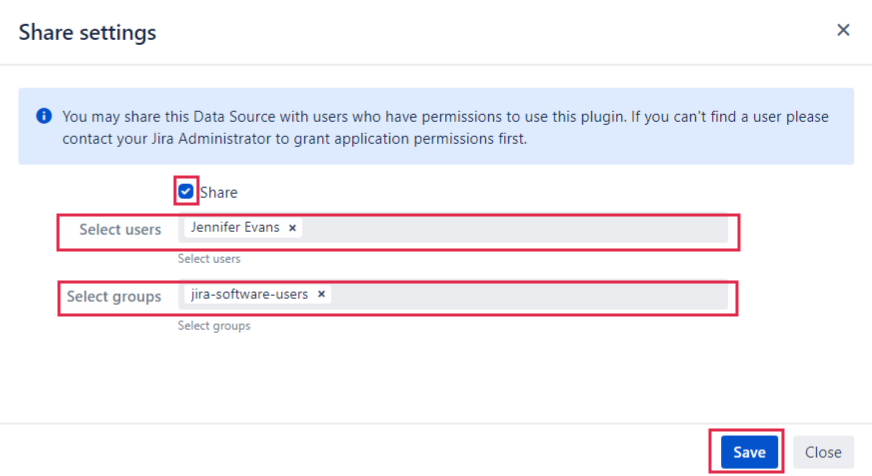
Share checkbox - check to activate “select users” and “select groups” fields.
Select users - start typing to find and add relevant users.
Select groups -start typing to find and add relevant users group.
Save - click to apply changes.
Please note! Other users who have access to Power BI Connector for Jira app might not get all data from this data source due to different Jira permissions.
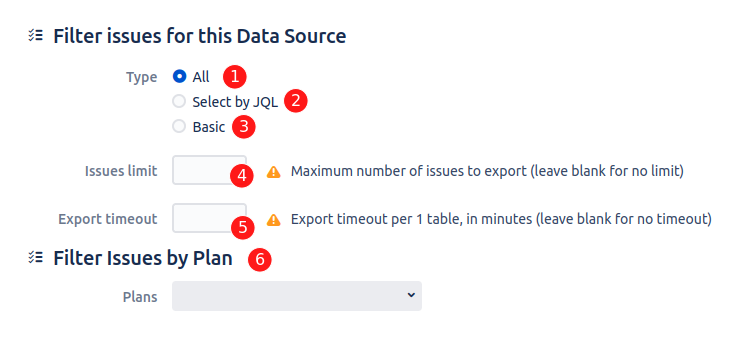
Filter issues section
1. All - choose if you want to export all existing issues.
2. Select by JQL - choose if you want to use JQL to create your own request and filter data.
JQL, or Jira Query Language, is a flexible tool that allows you to search for issues, projects, etc in Jira and pinpoint exactly what you are looking for.
3. Basic - choose if you want to use standard fields filters. You can learn how to use Basic filters below.
4. Issues limit - Maximum number of issues to export (leave blank for no limit). If the Jira Administrator set the issue limit user will see an alert message.
5. Export timeout - Export timeout per 1 table, in minutes (leave blank for no timeout).
6. Filter Issues by Plan - Filtering by Advanced Roadmaps (former Portfolio) plans.
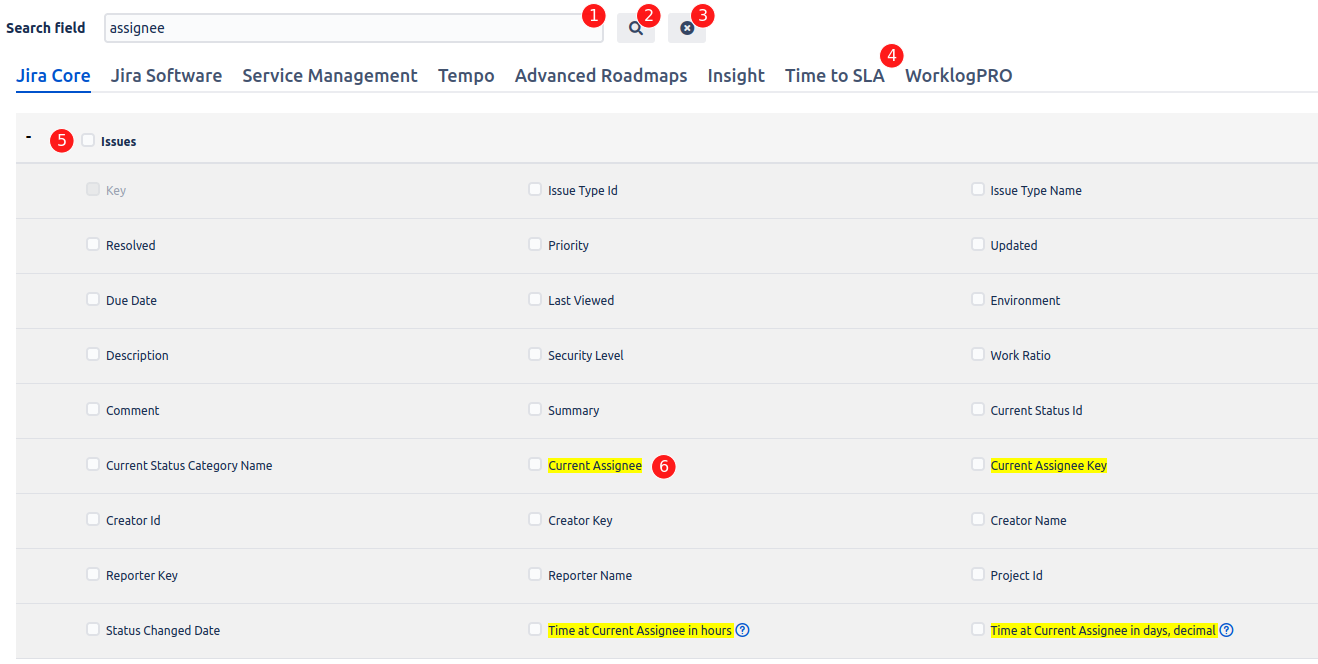
Select Fields section
1. Search field -enter the required field that you want to display in the report.
2. Magnifier - click to search the required item you want to add to your data source.
3. Clear the search field.
4. Tabs with Jira Fields:
Jira Core Fields - displays a list of regular Jira Core fields and items
Jira Software Fields - displays a list of regular Jira Software fields and items (if Jira Software is licensed)
Jira Service Desk Fields - displays a list of regular Jira Service Desk fields (if Jira Service Desk is licensed)
Tempo fields - displays a list of Tempo Timesheets and Tempo Planner fields (if plugins are installed)
Advanced Roadmaps - displays Advanced Roadmaps plugin fiedlds (if plugin is installed)
Insight fields - displays Insight Asset Management plugin fields (if plugin is installed)
5. Issues - one of the issue files subsection. Choose if you want to add all fields in a certain subsection.
6. Checkbox - check the box with the required field.
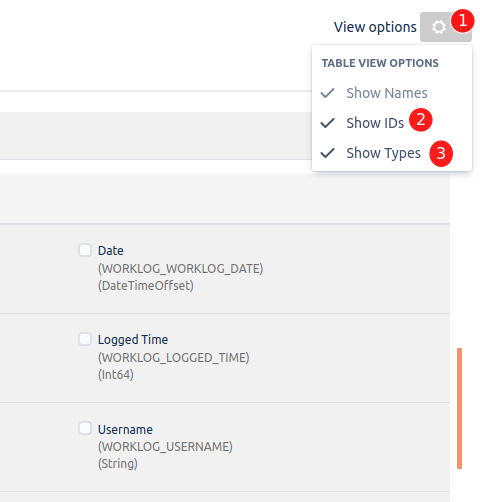
View Options section
1. Click Cog icon to open View options
2. Click Show IDs to see the field names how they will appear in Power BI. Click again to hide IDs.
3. Click Show Types to see the field types. Click again to hide Types.
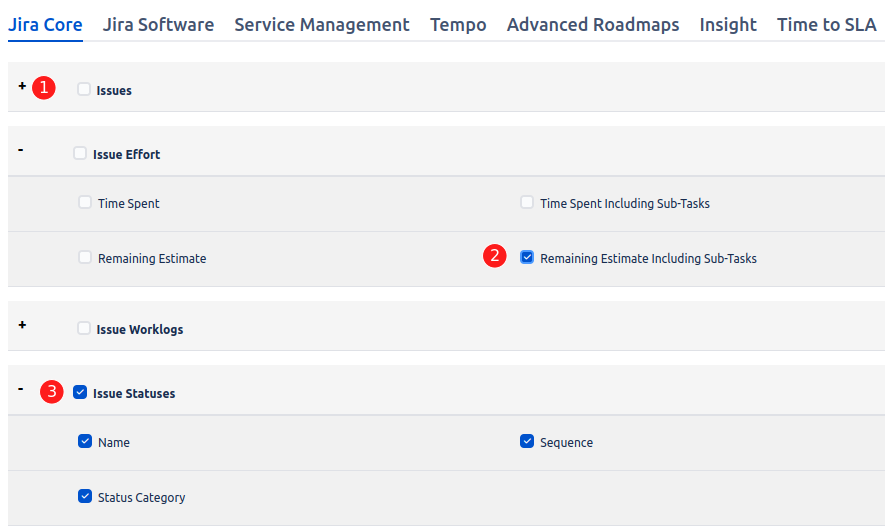
Expandable tables
1. Click + to expand the Table and see all available fields for export
2. Select the exact fields you need for the reports
3. Click the checkbox next to the Table name to select all fields from that Table
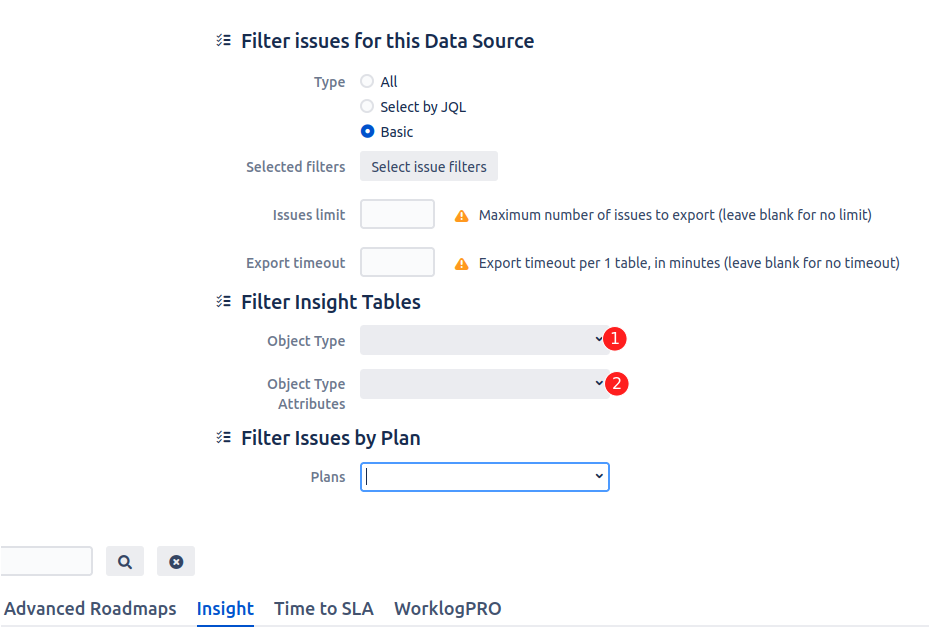
Filter Insight fields section
Since Insight schemes can store thousands or even millions individual objects each with potentially many attributes, so importing the attributes table without any filtering will be a huge problem. Also many of the objects and attributes could be of little interest to the reporting engine.
Insight Fields filter is located at tab Insight and allows to filter out the uninteresting data and greatly reduce import record set.
1. To filter by Object Type start to type Object Type name and choose from the list
2. To filter by Object Type Attributes start to type Object Type Attribute name and choose from the list
Filter will be applied to selected Insight Tables where Obect_type_id and/or Object_type_attributes_id are present.
“Apply” section
1. Create - click to create a data source.
2. Preview - Click to check the source name/description/issue filters/export items.
3. Close - leave data source creating page. Changes you’ve made will not be saved.

How to import data into your Microsoft Power BI?
To work with Power BI, Power BI Connector for Jira generates the Data Source URL. Use this URL to import data to your Power BI Desktop.
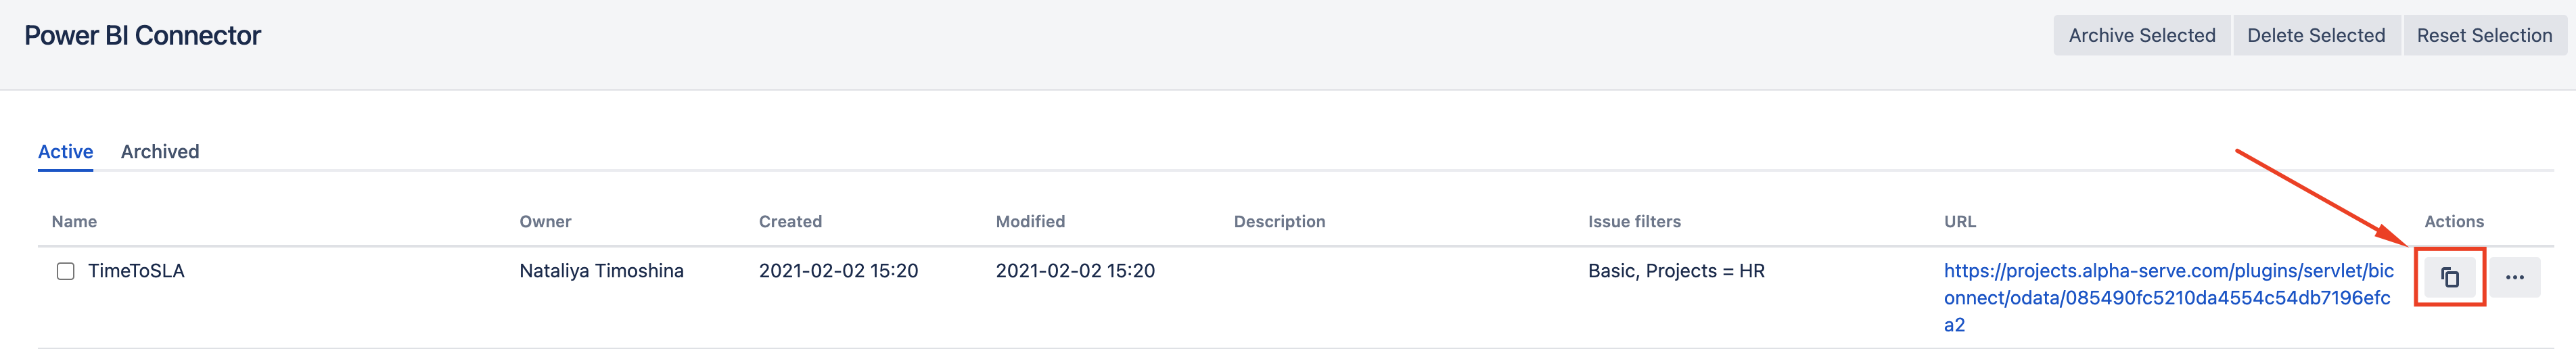
Step 1. Copy the URL of your connector, generated by the app.
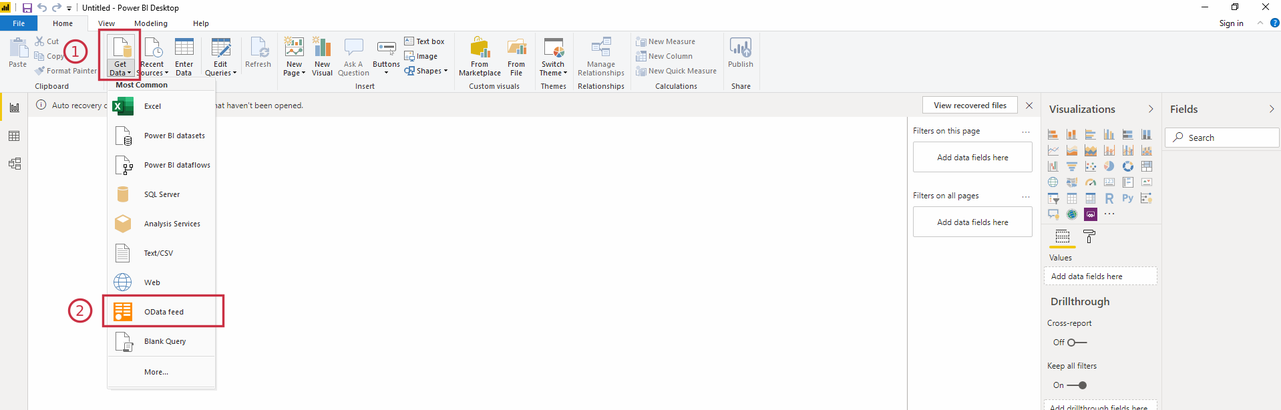
Step 2. Launch Power BI Desktop and Click Get Data > OData feed and paste the URL.
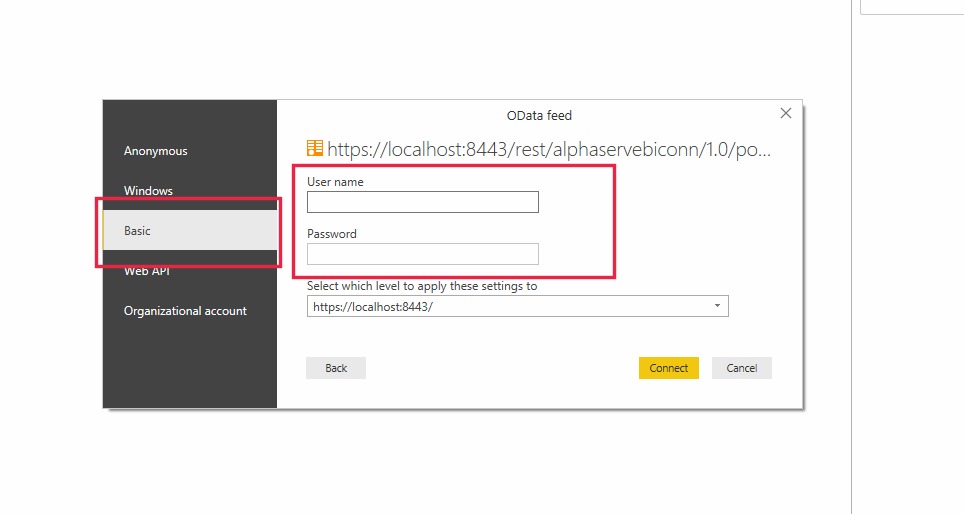
Step 3. Authorize by basic authorization in Power BI with your Jira credentials.
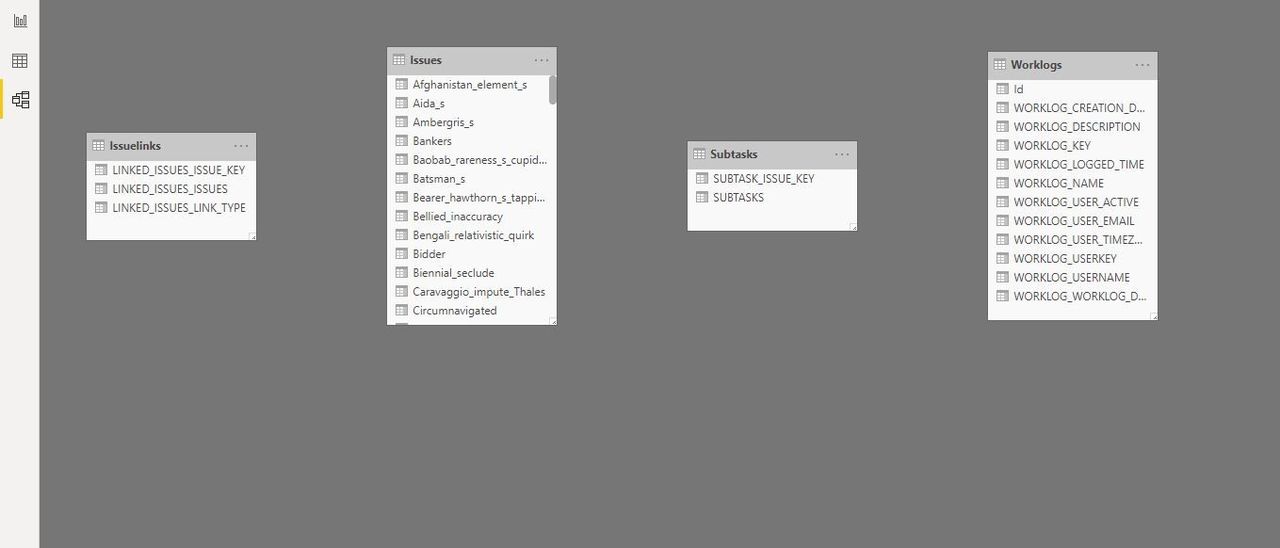
Step 4. Select the tables you need and click Load.
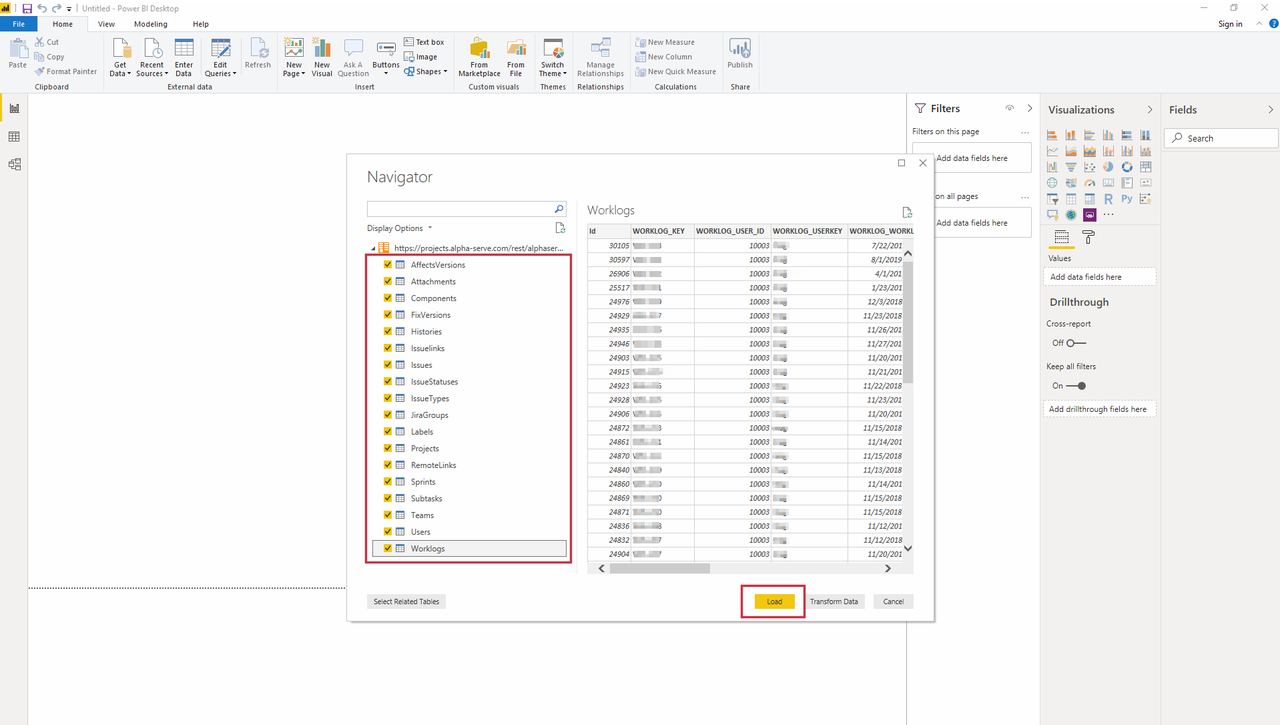
After step 4 data will be loaded into Power BI.
If there is a big amount of data to be imported, it can take some time.
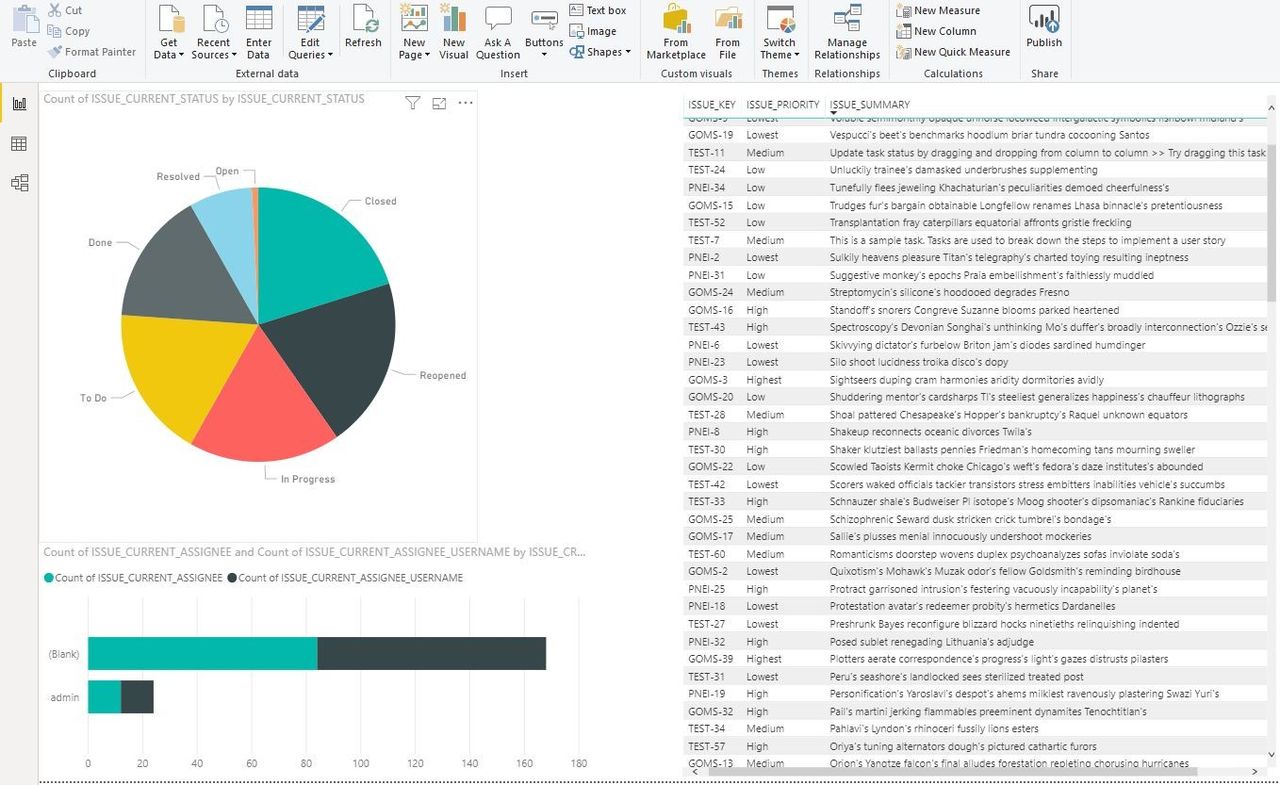
After this, you can start building graphs and dashboards based on the imported Jira data. To do this, choose the visualization type and select the data you want to see on the graph or dashboard.
How to archive Data Source
Archiving Data Source can be helpful when connectors should be disabled without being removed.
Click ellipsis next to the Copy icon
Select Archive
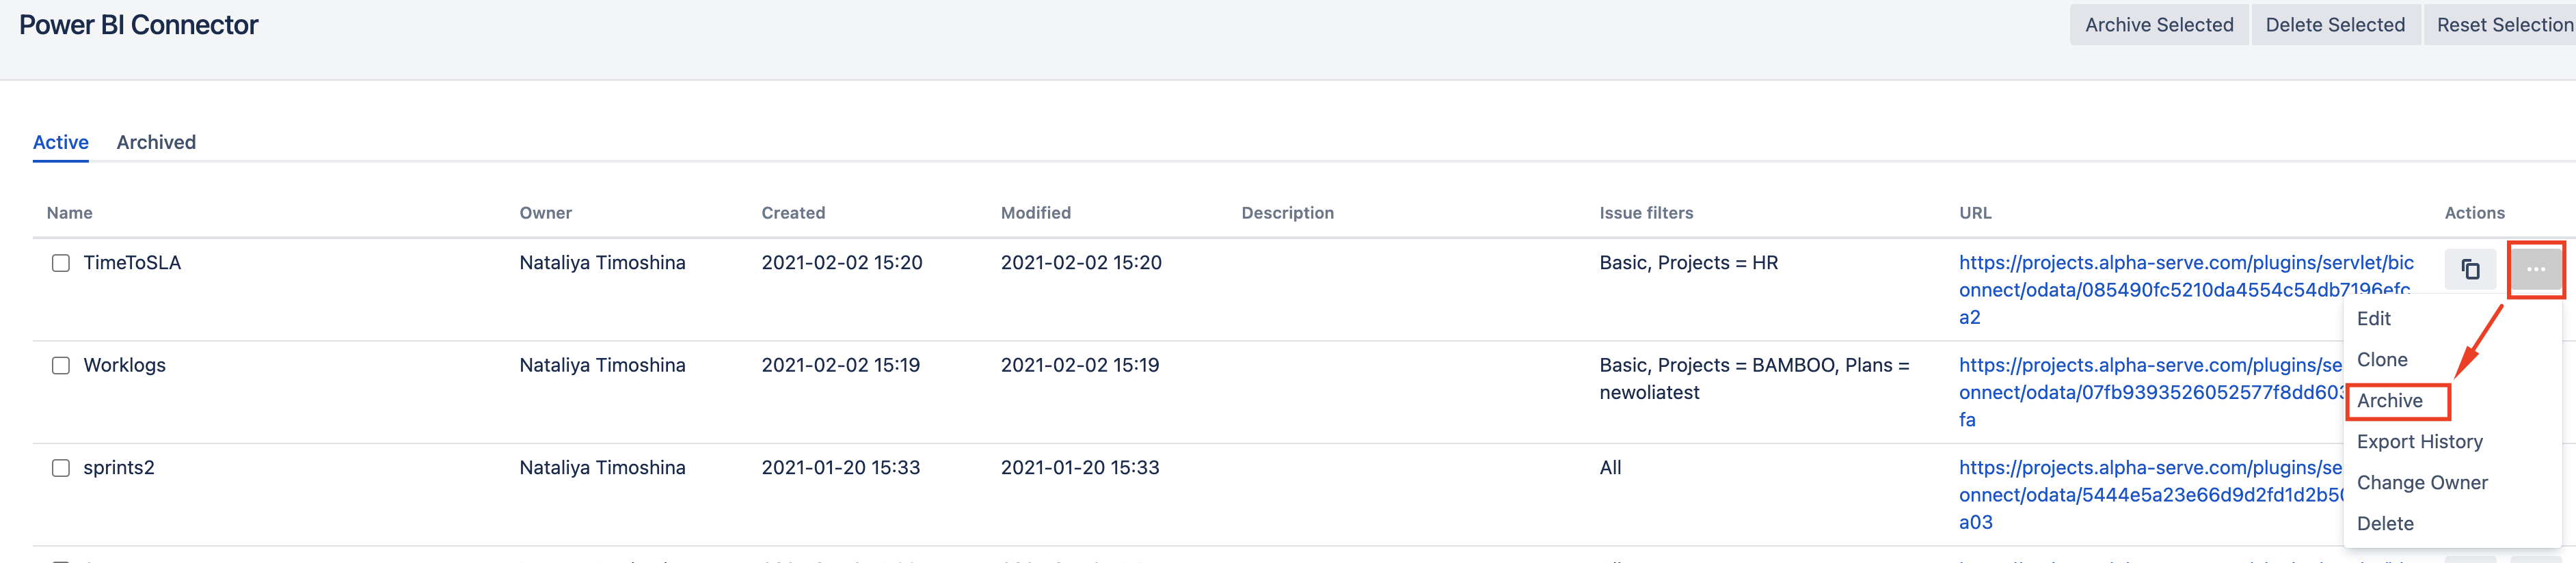
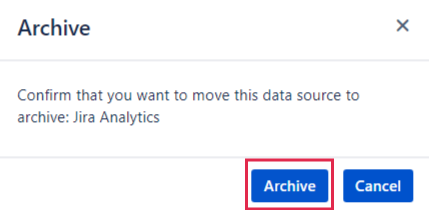
3. Click Archive to archive the Data Source
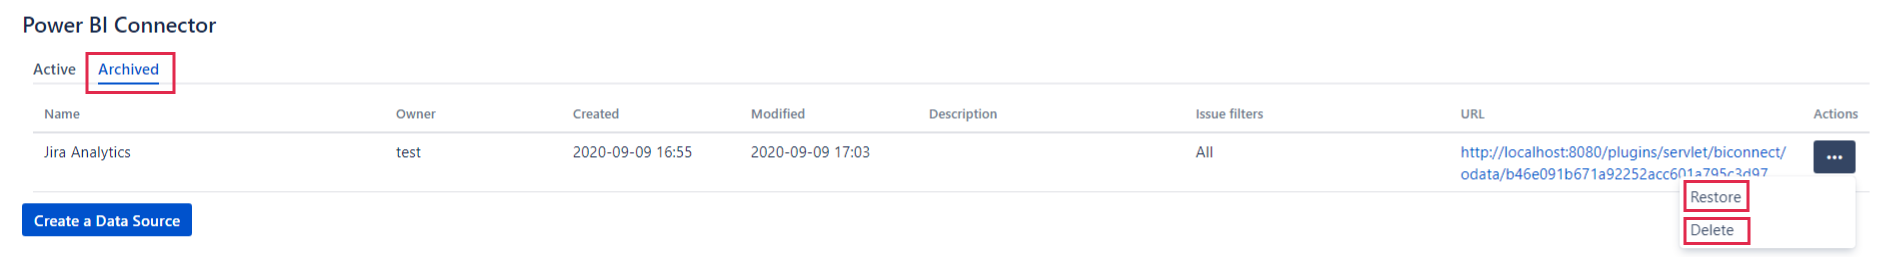
4. Archived Data Source can be found in Archived tab. From Archived tab Data Source can be Restored or Deleted.
| Excerpt | ||
|---|---|---|
| ||
How to use Basic issue filters?
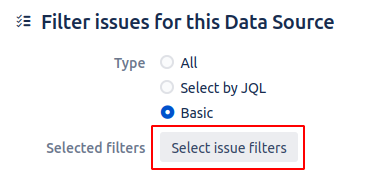
Step 1. After choosing Basic issue filters click Select issue filters button below.
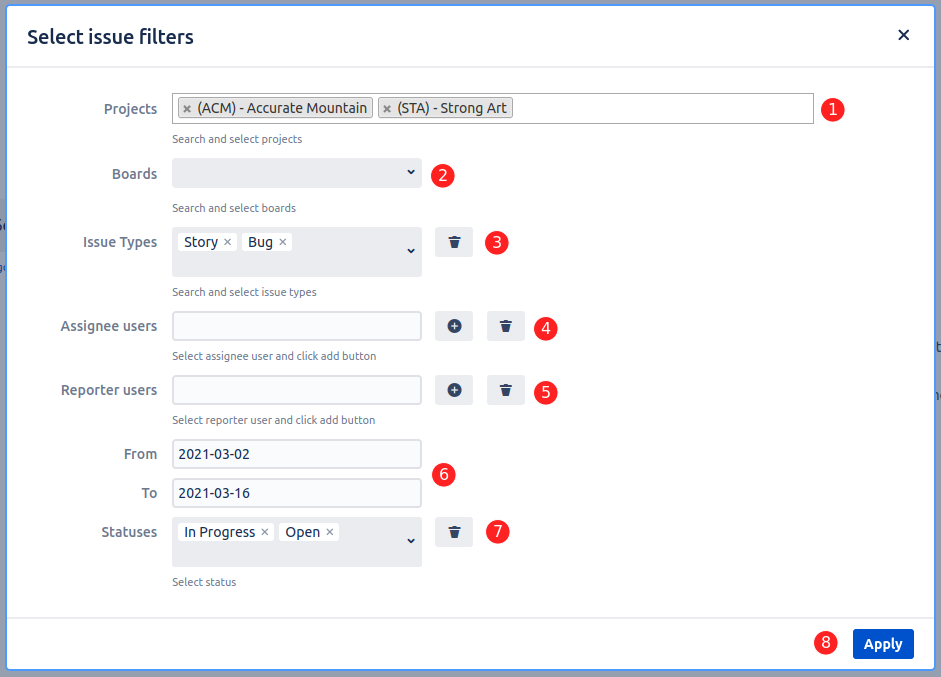
Step 2. In the opened pop-up window you can:
Projects - filter issue by project.
Boards - filter issues by boards.
Issues Types - filter issue by types (Epic/Story/Task/Bug/Sub-task).
Assignee users - filter issue by assignee users. Select assignee user and click +.
Reporter users - filter issue by reporter users. Select reporter user and click +.
Select period - filter issue by date.
Statuses - filter issue by status (Open/In Progress/Reopenned/etc).
Apply form - apply chosen filters.
Note: Only fields that relevant to Basic Filter criteria will be shown.
E.g. user filters by ProjectABC (1). Then only relevant to the ProjectABC Issue Types(2) and Statuses(6) will be shown for further filtering. Moreover, only relevant to the ProjectABC custom fields will be shown in Issue Custom Fields section.
How to use Software Tables filter?
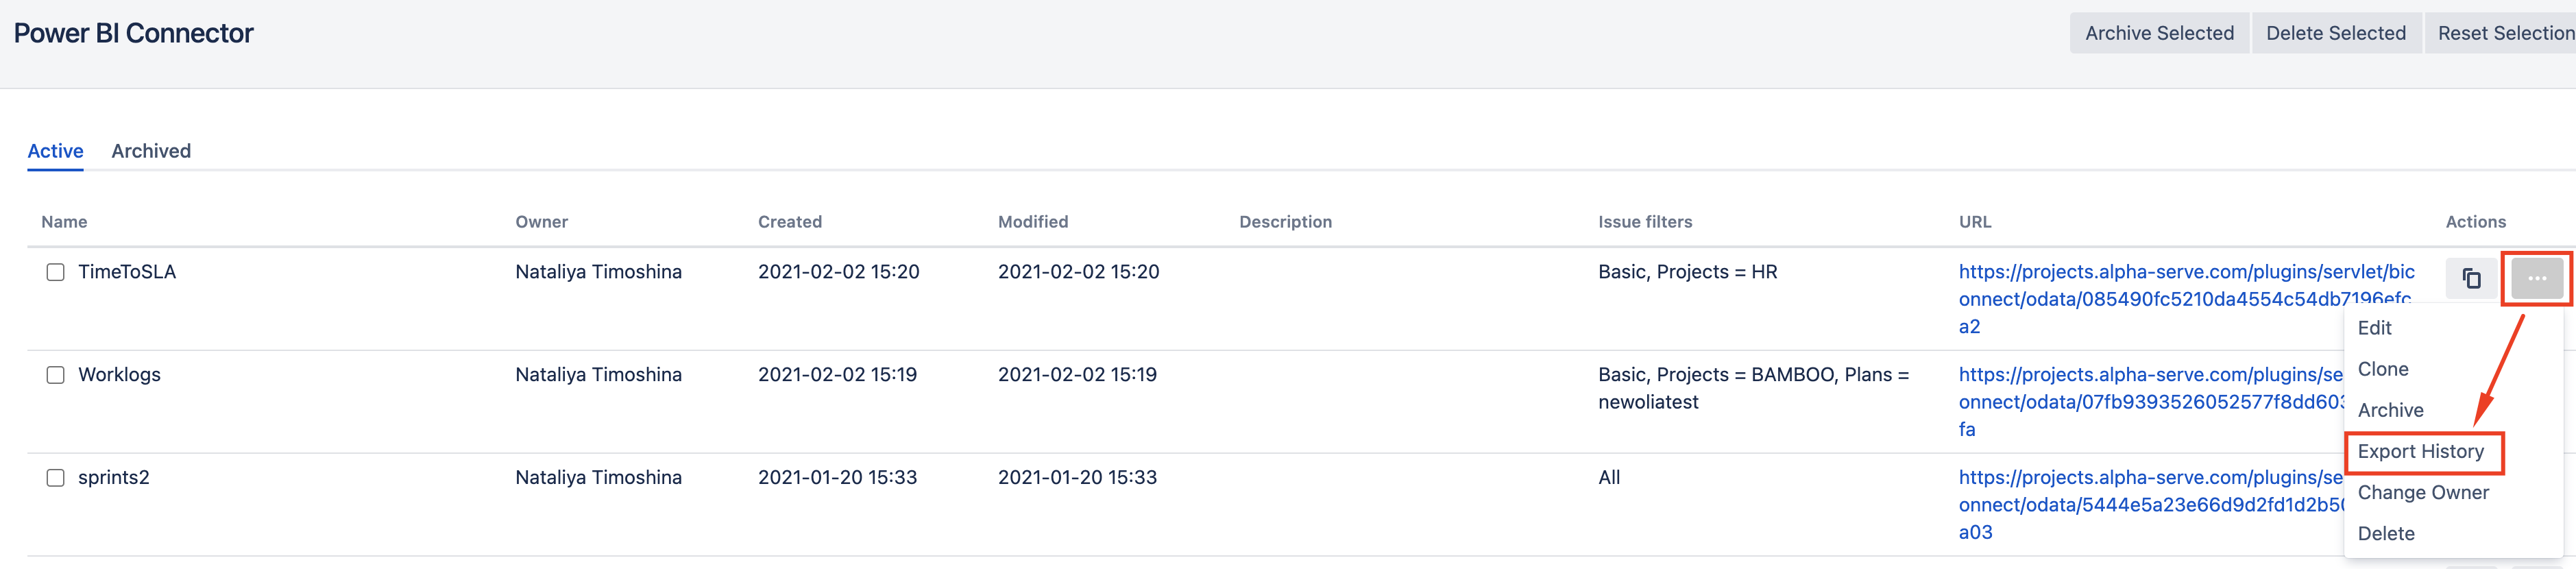
How to view Data Source Export History?
Click … button near the connector and select Export History
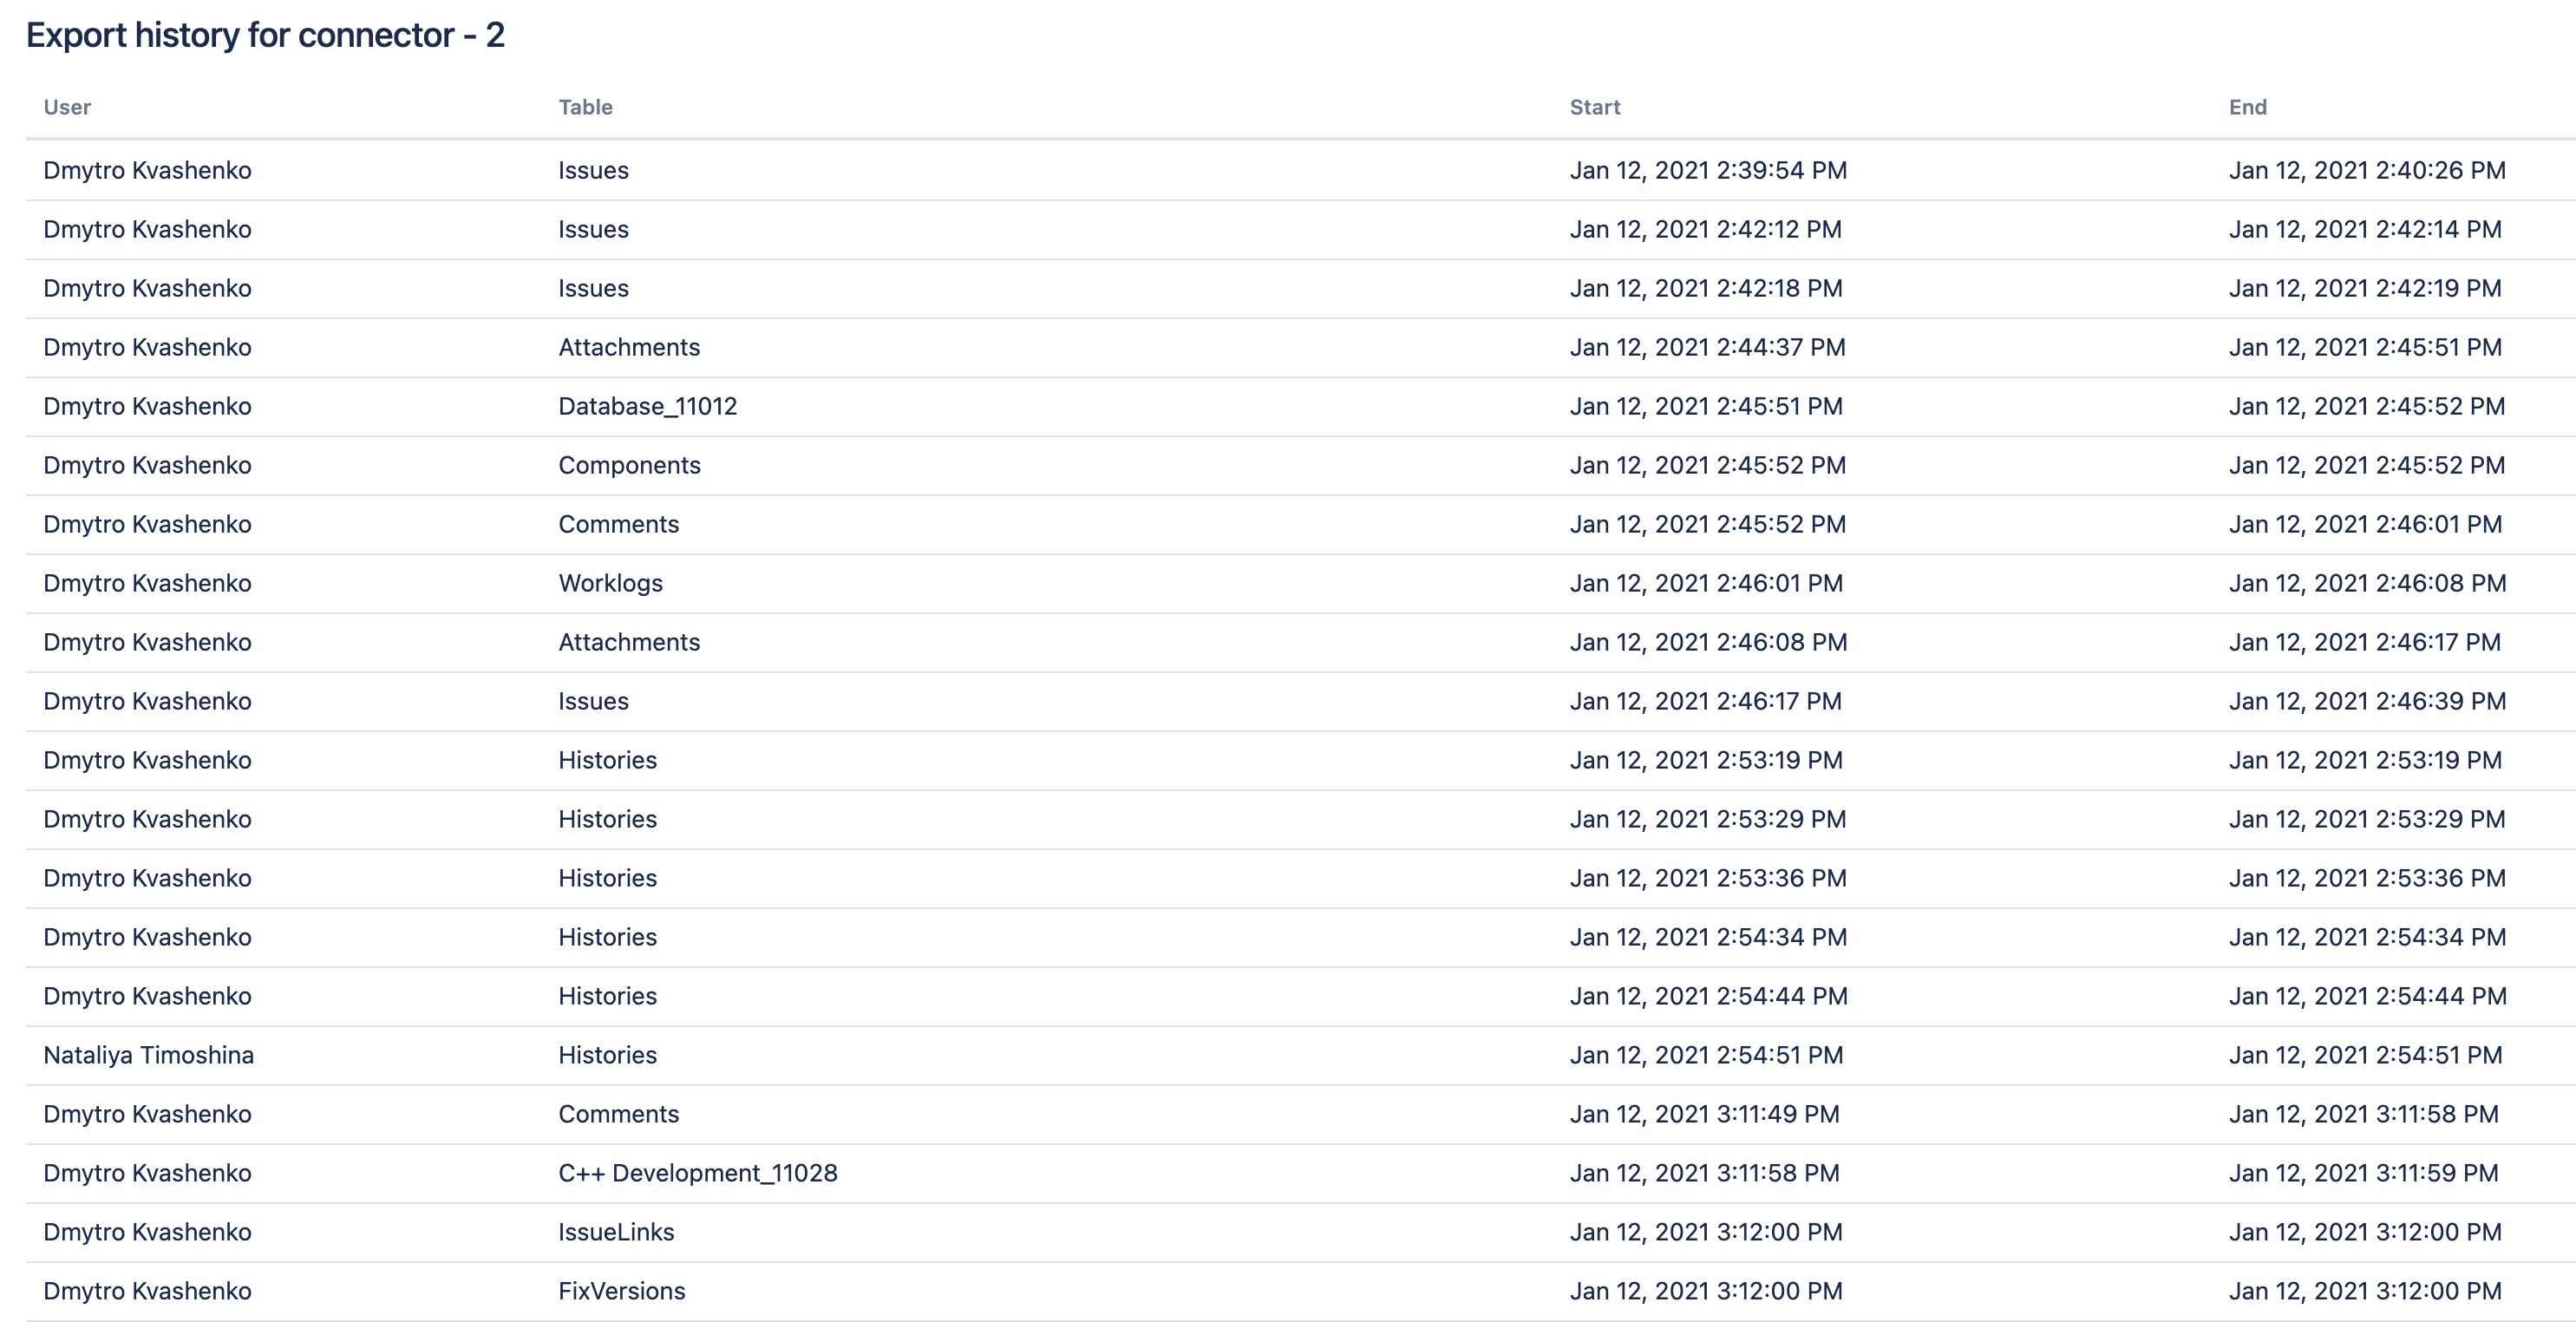
2. In the opened page you can see the list of all tables exported with help of this connector. The information includes name of a user who performed exporting data, table name (each connector can pull data from multiple tables), export start and export end date.
What add-ons are supported?
See the constantly updating list here: Supported add-ons