| Table of Contents |
|---|
How to Use Power BI Templates?
Click on New from Template button from the Dashboard page
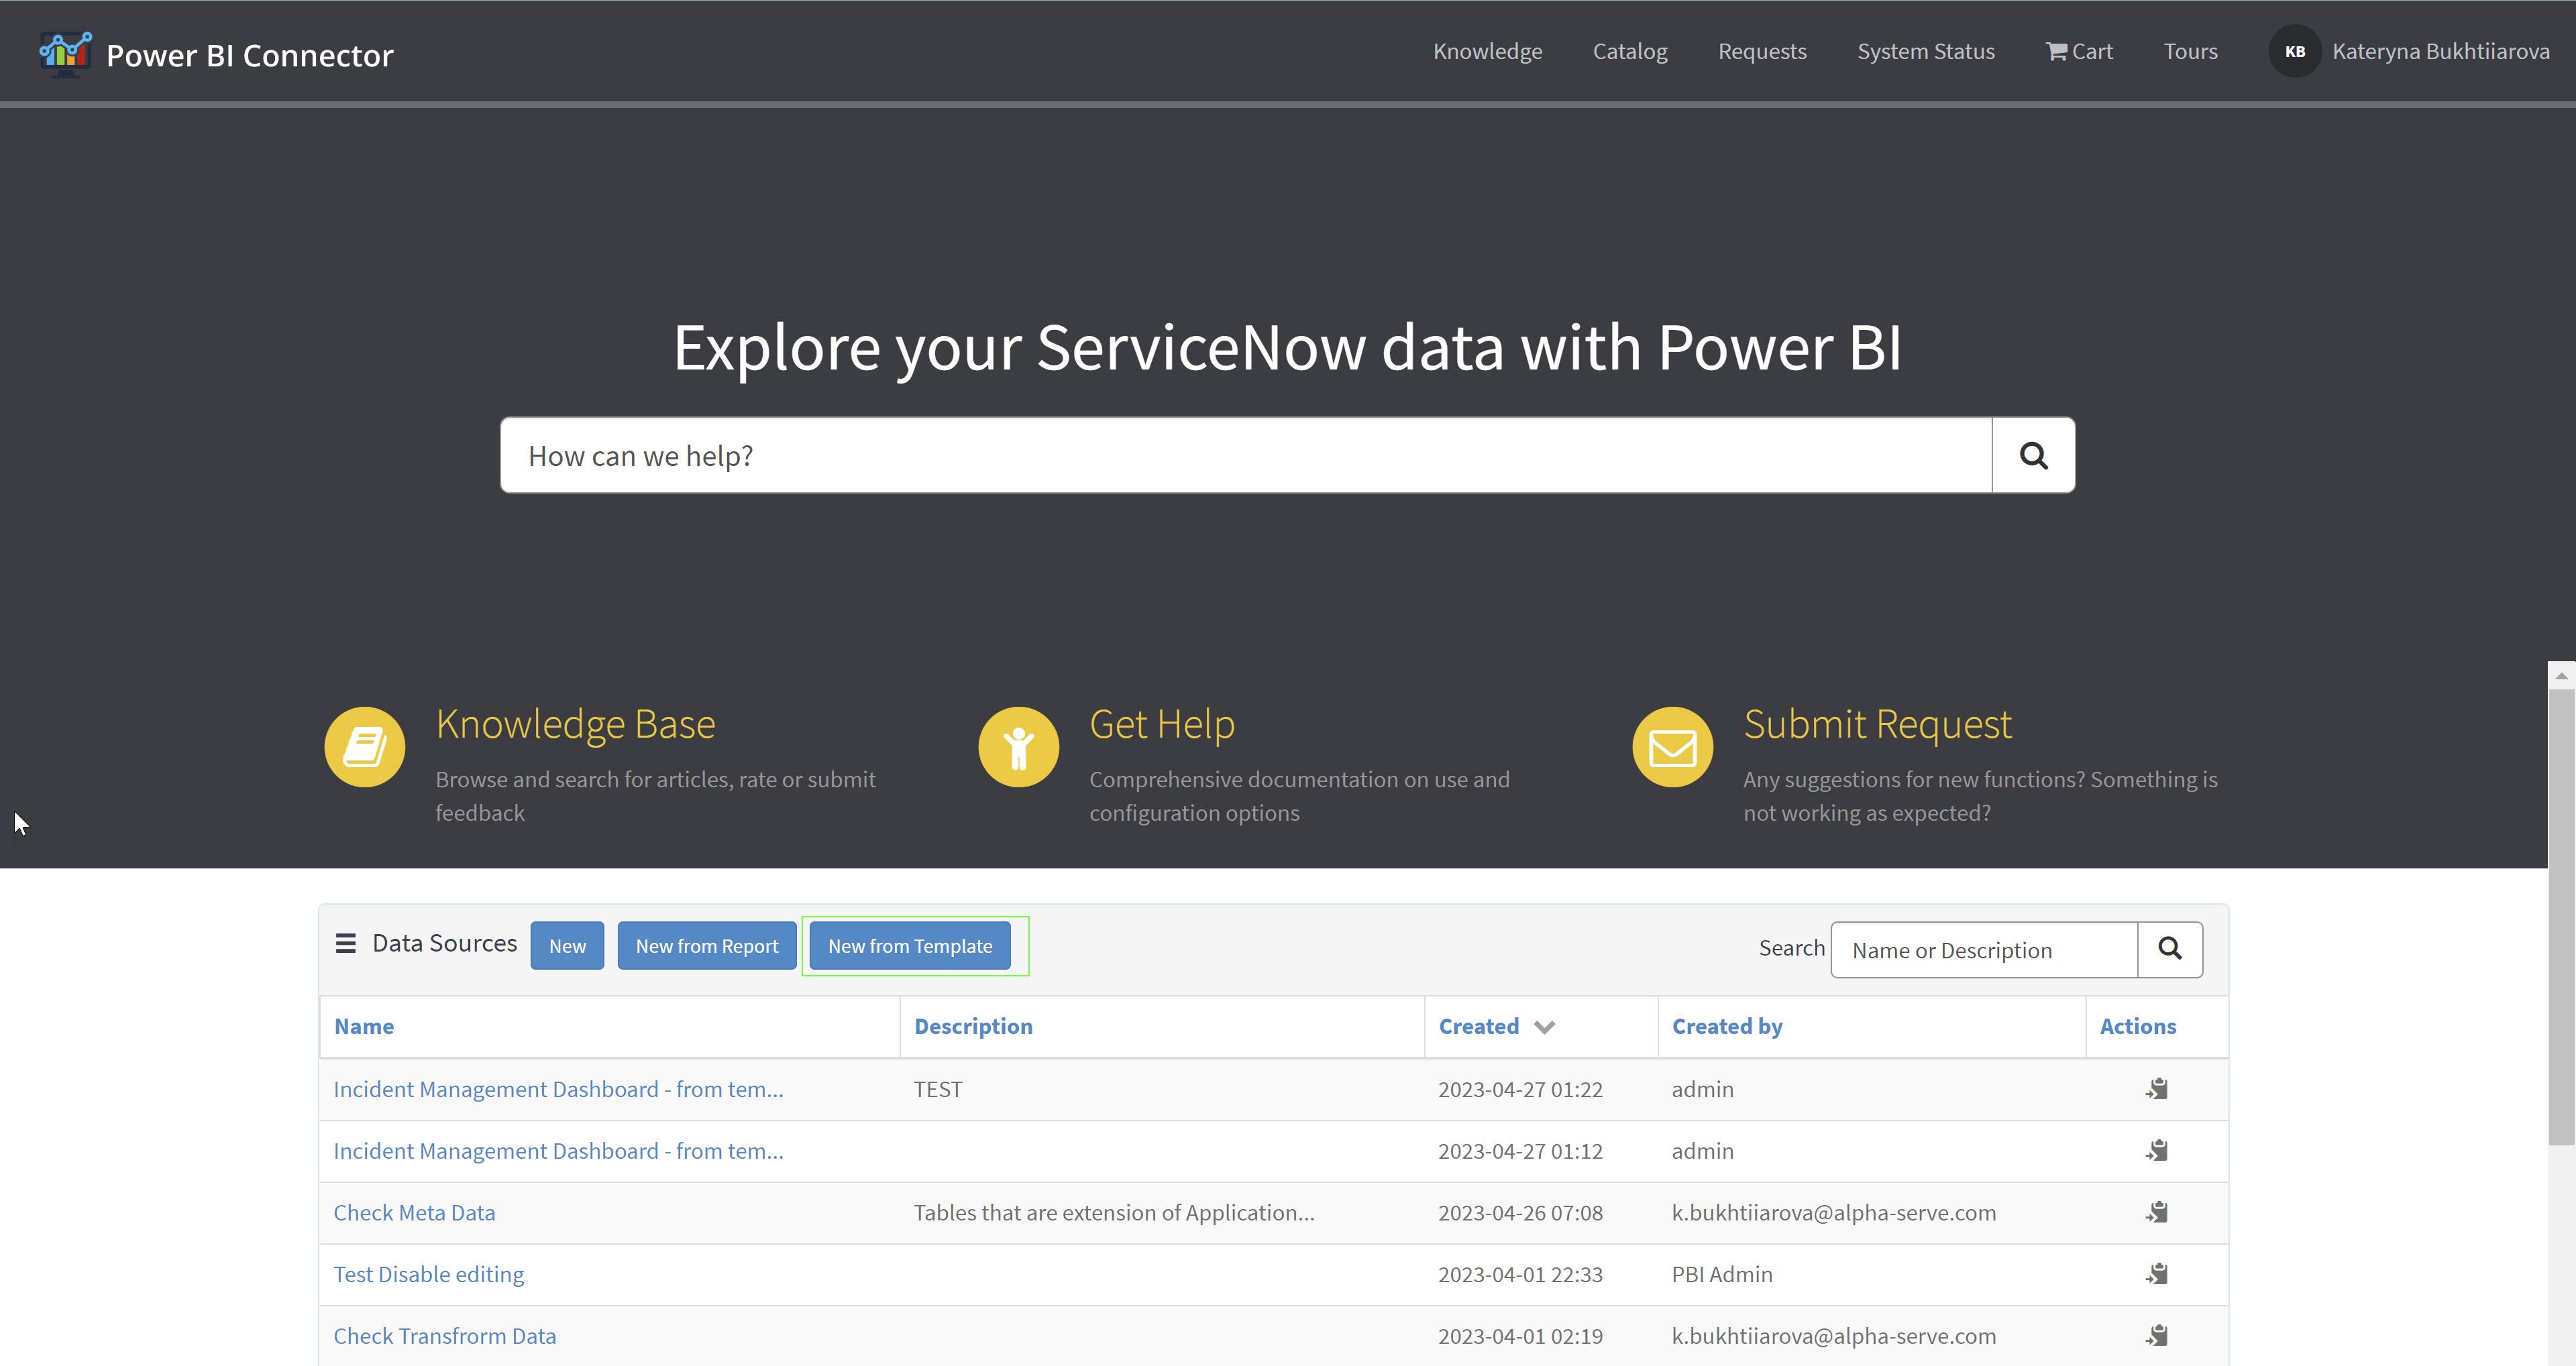
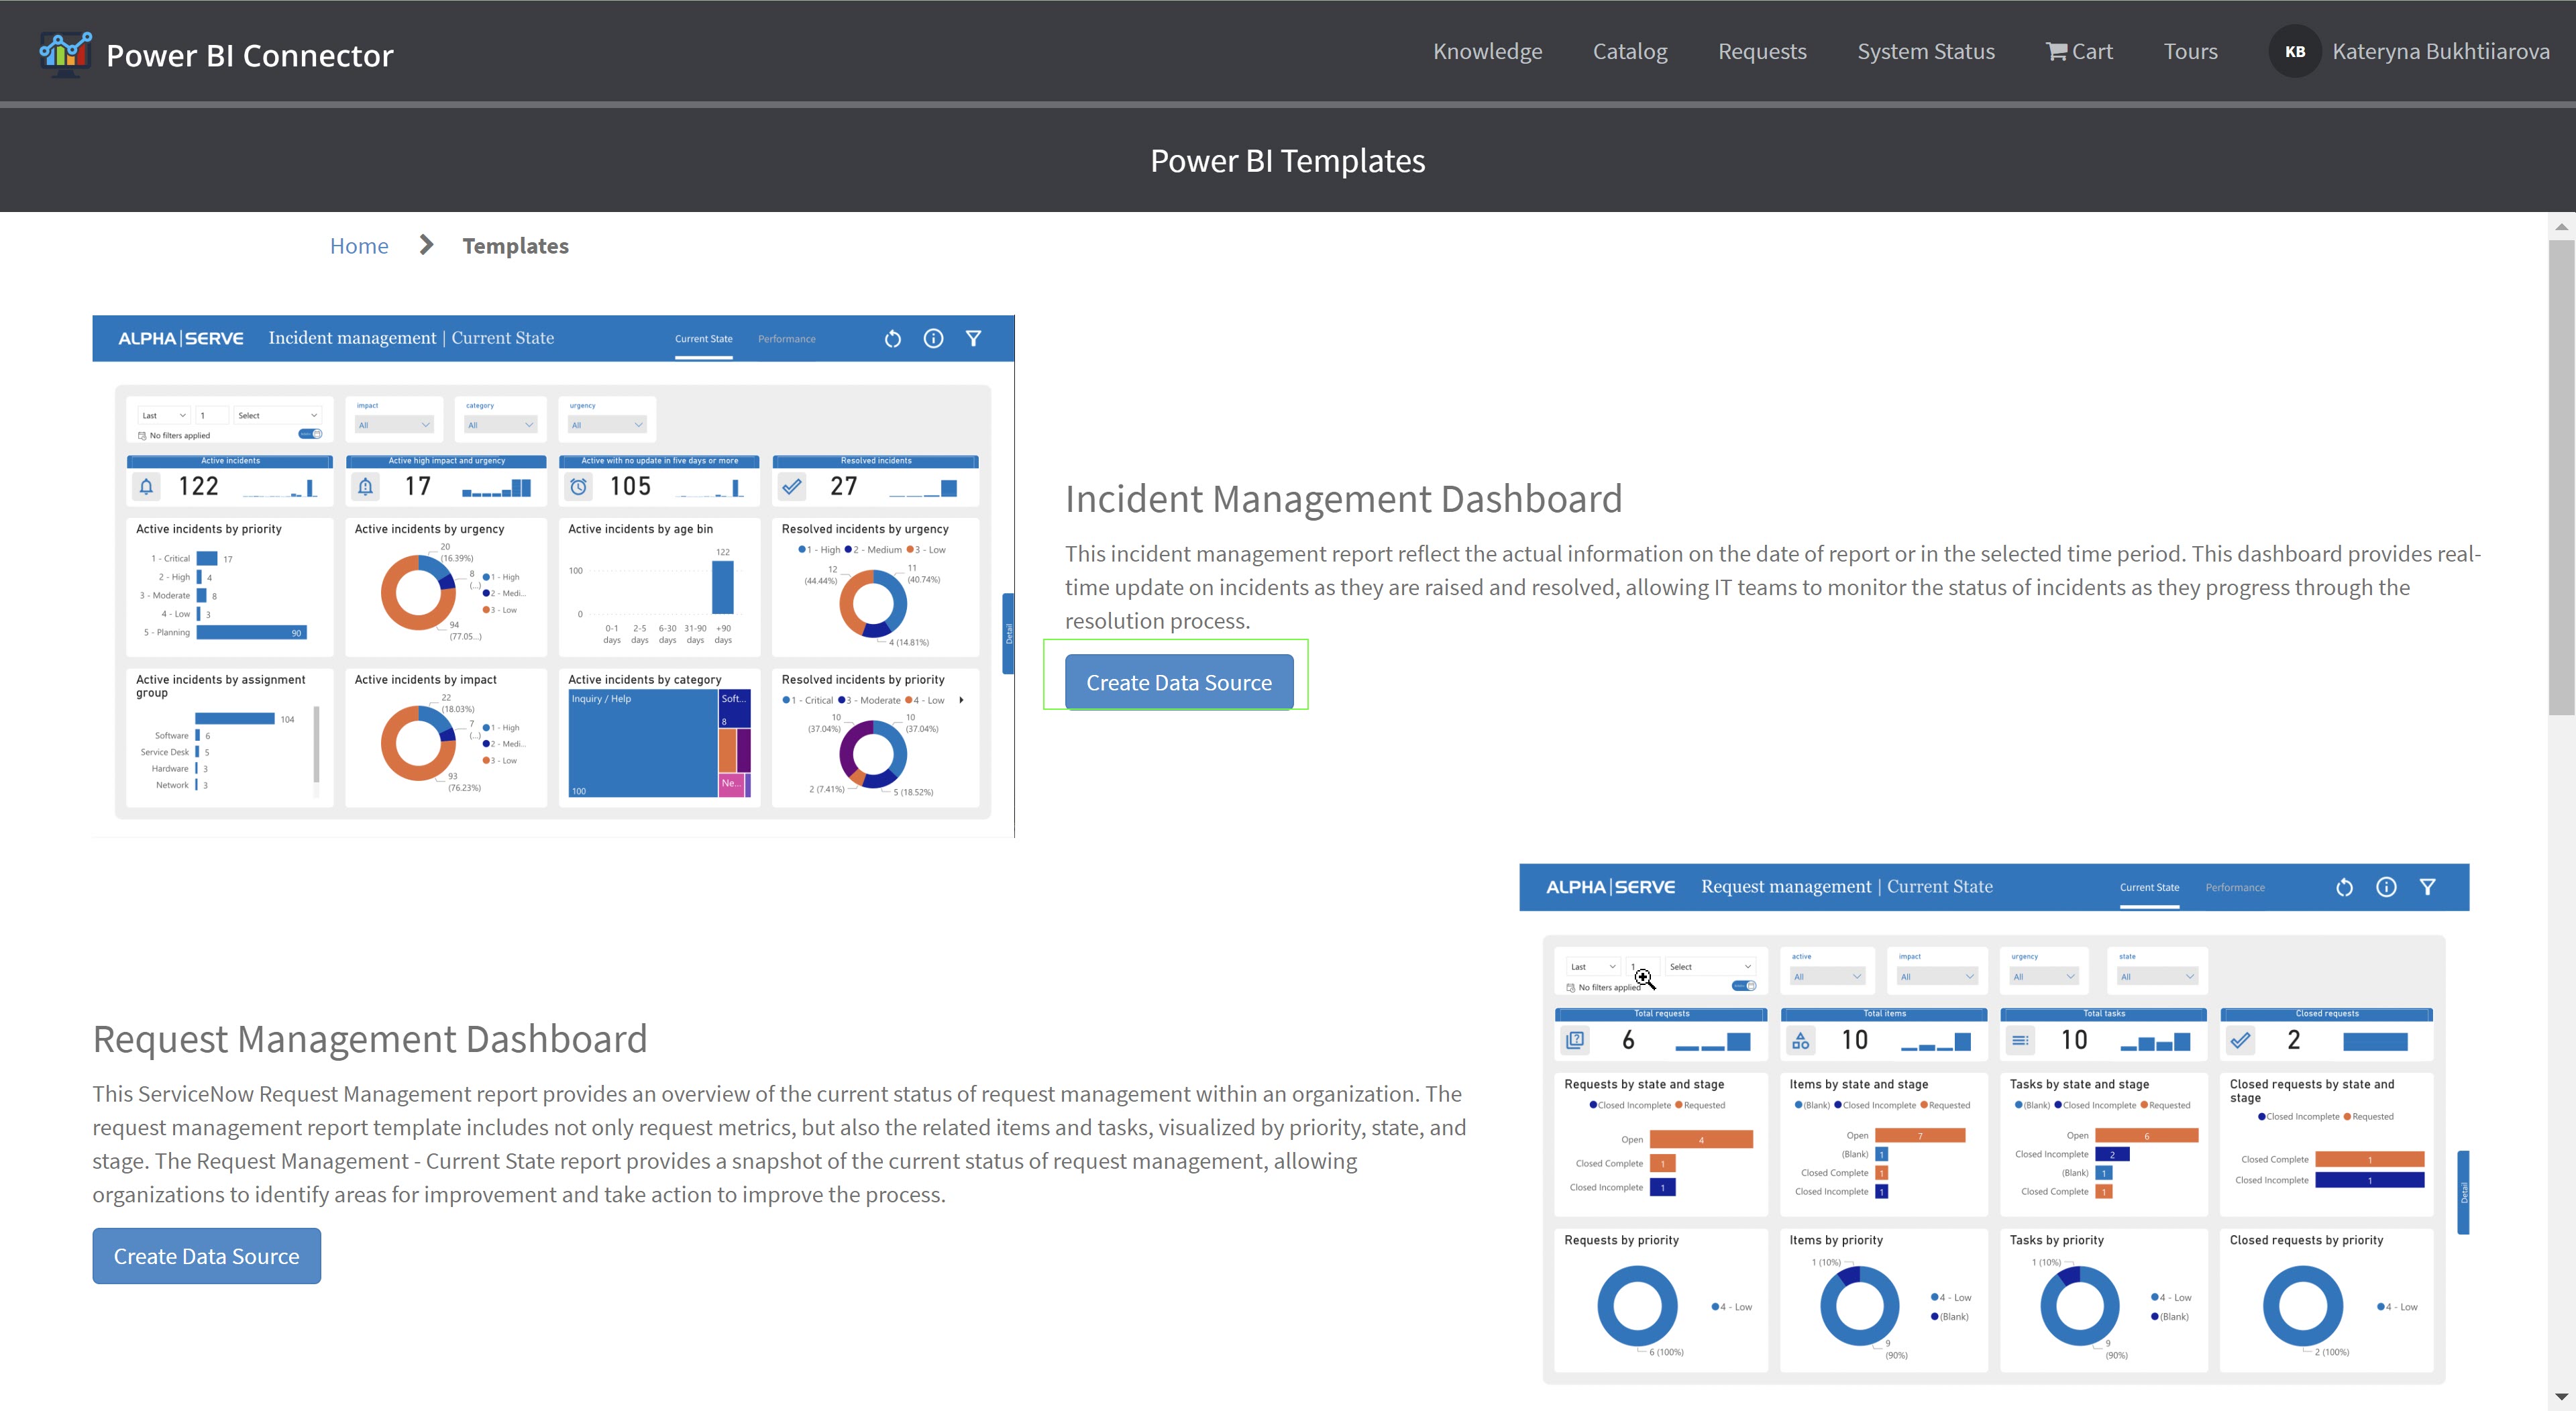
2. Select the template you would like to use and click on Create Data Source button.
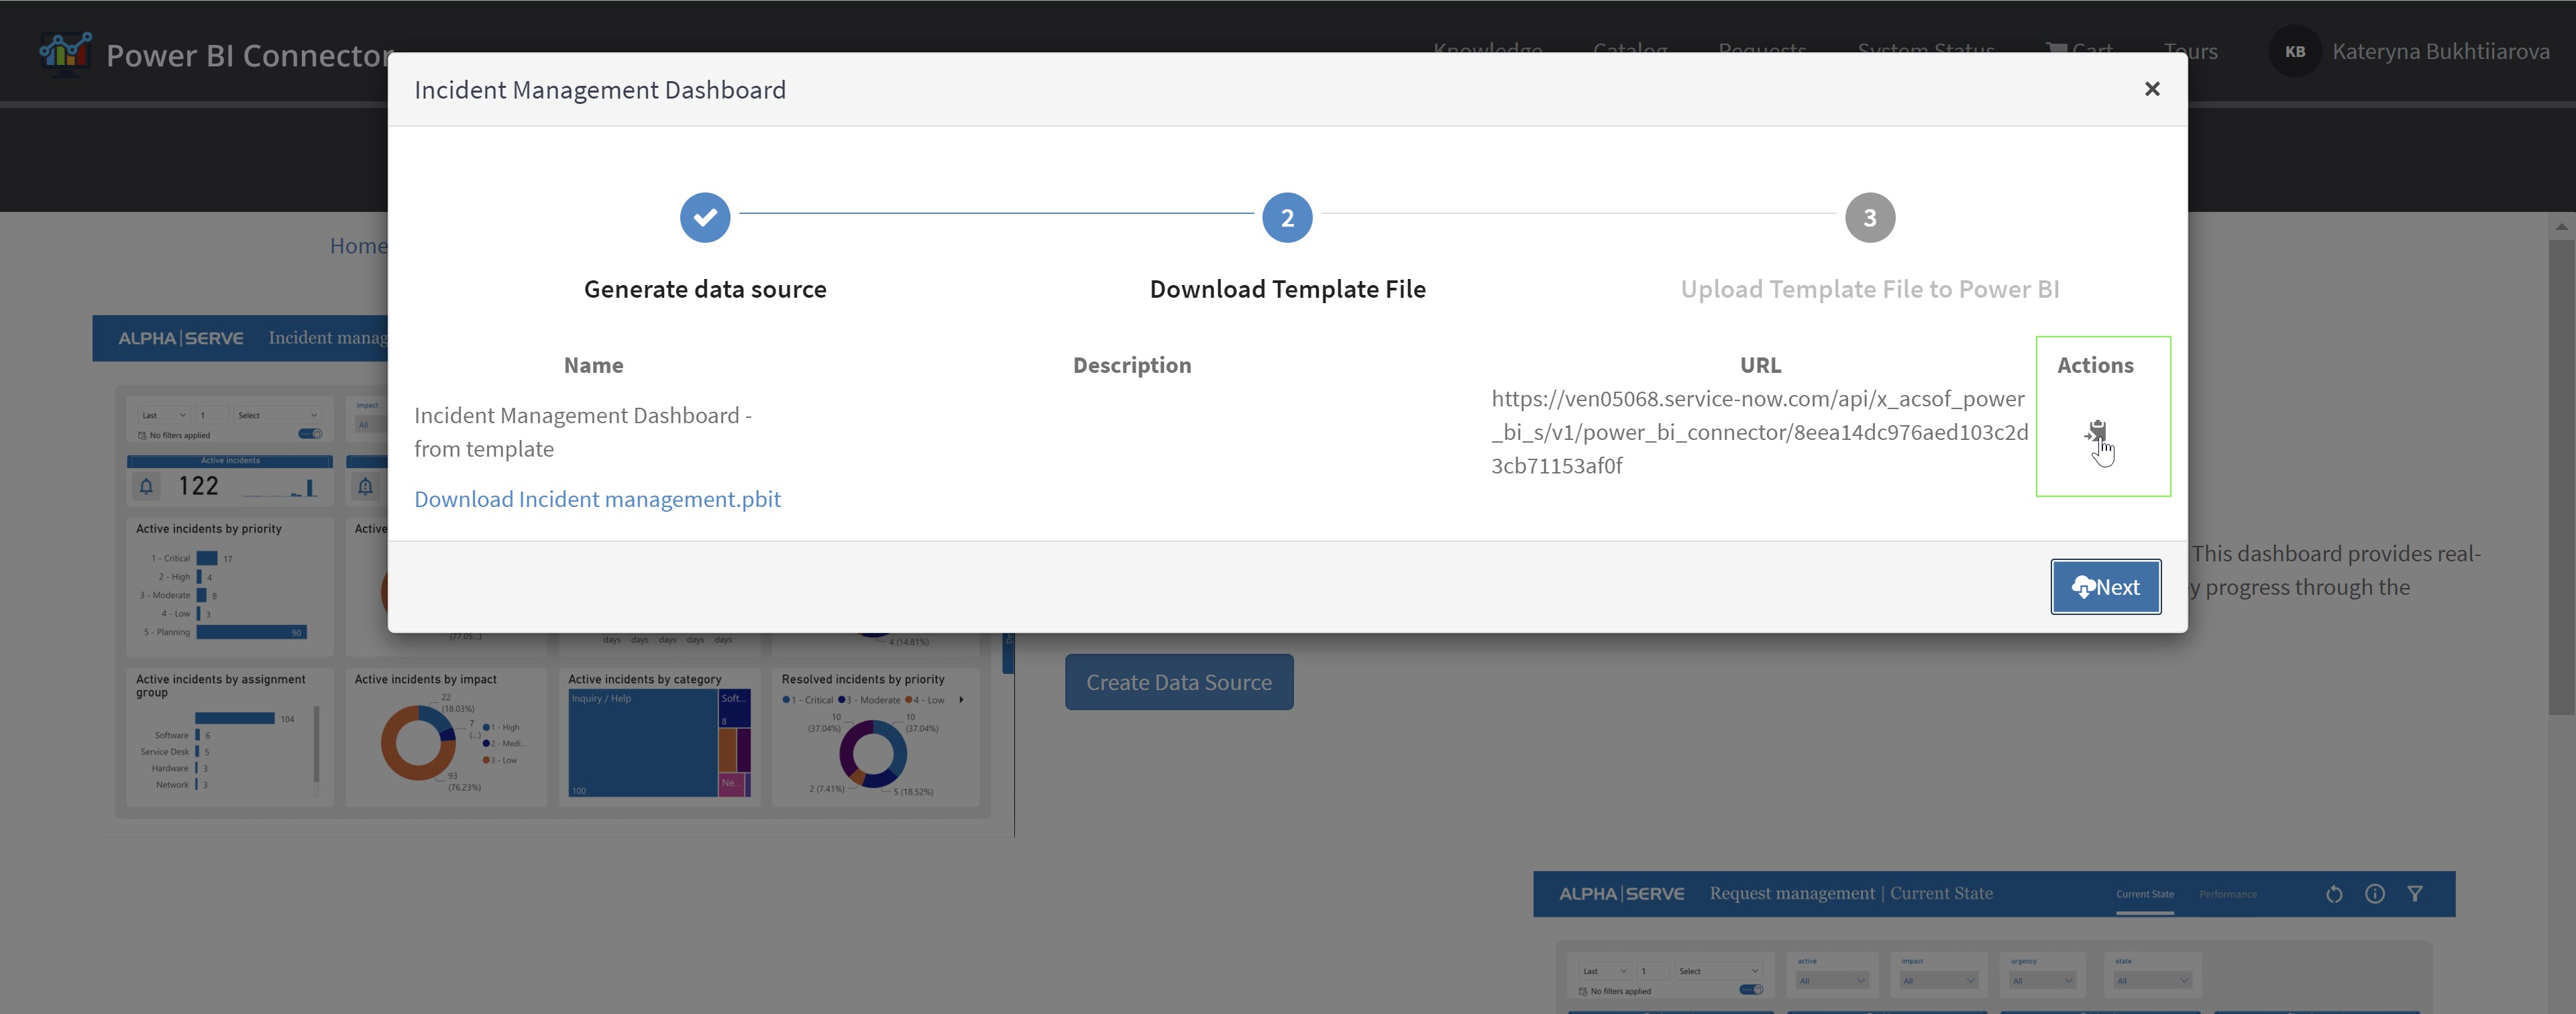
3. Set up the auto-generated data source. You can edit the data source name and add a description. Click Next.
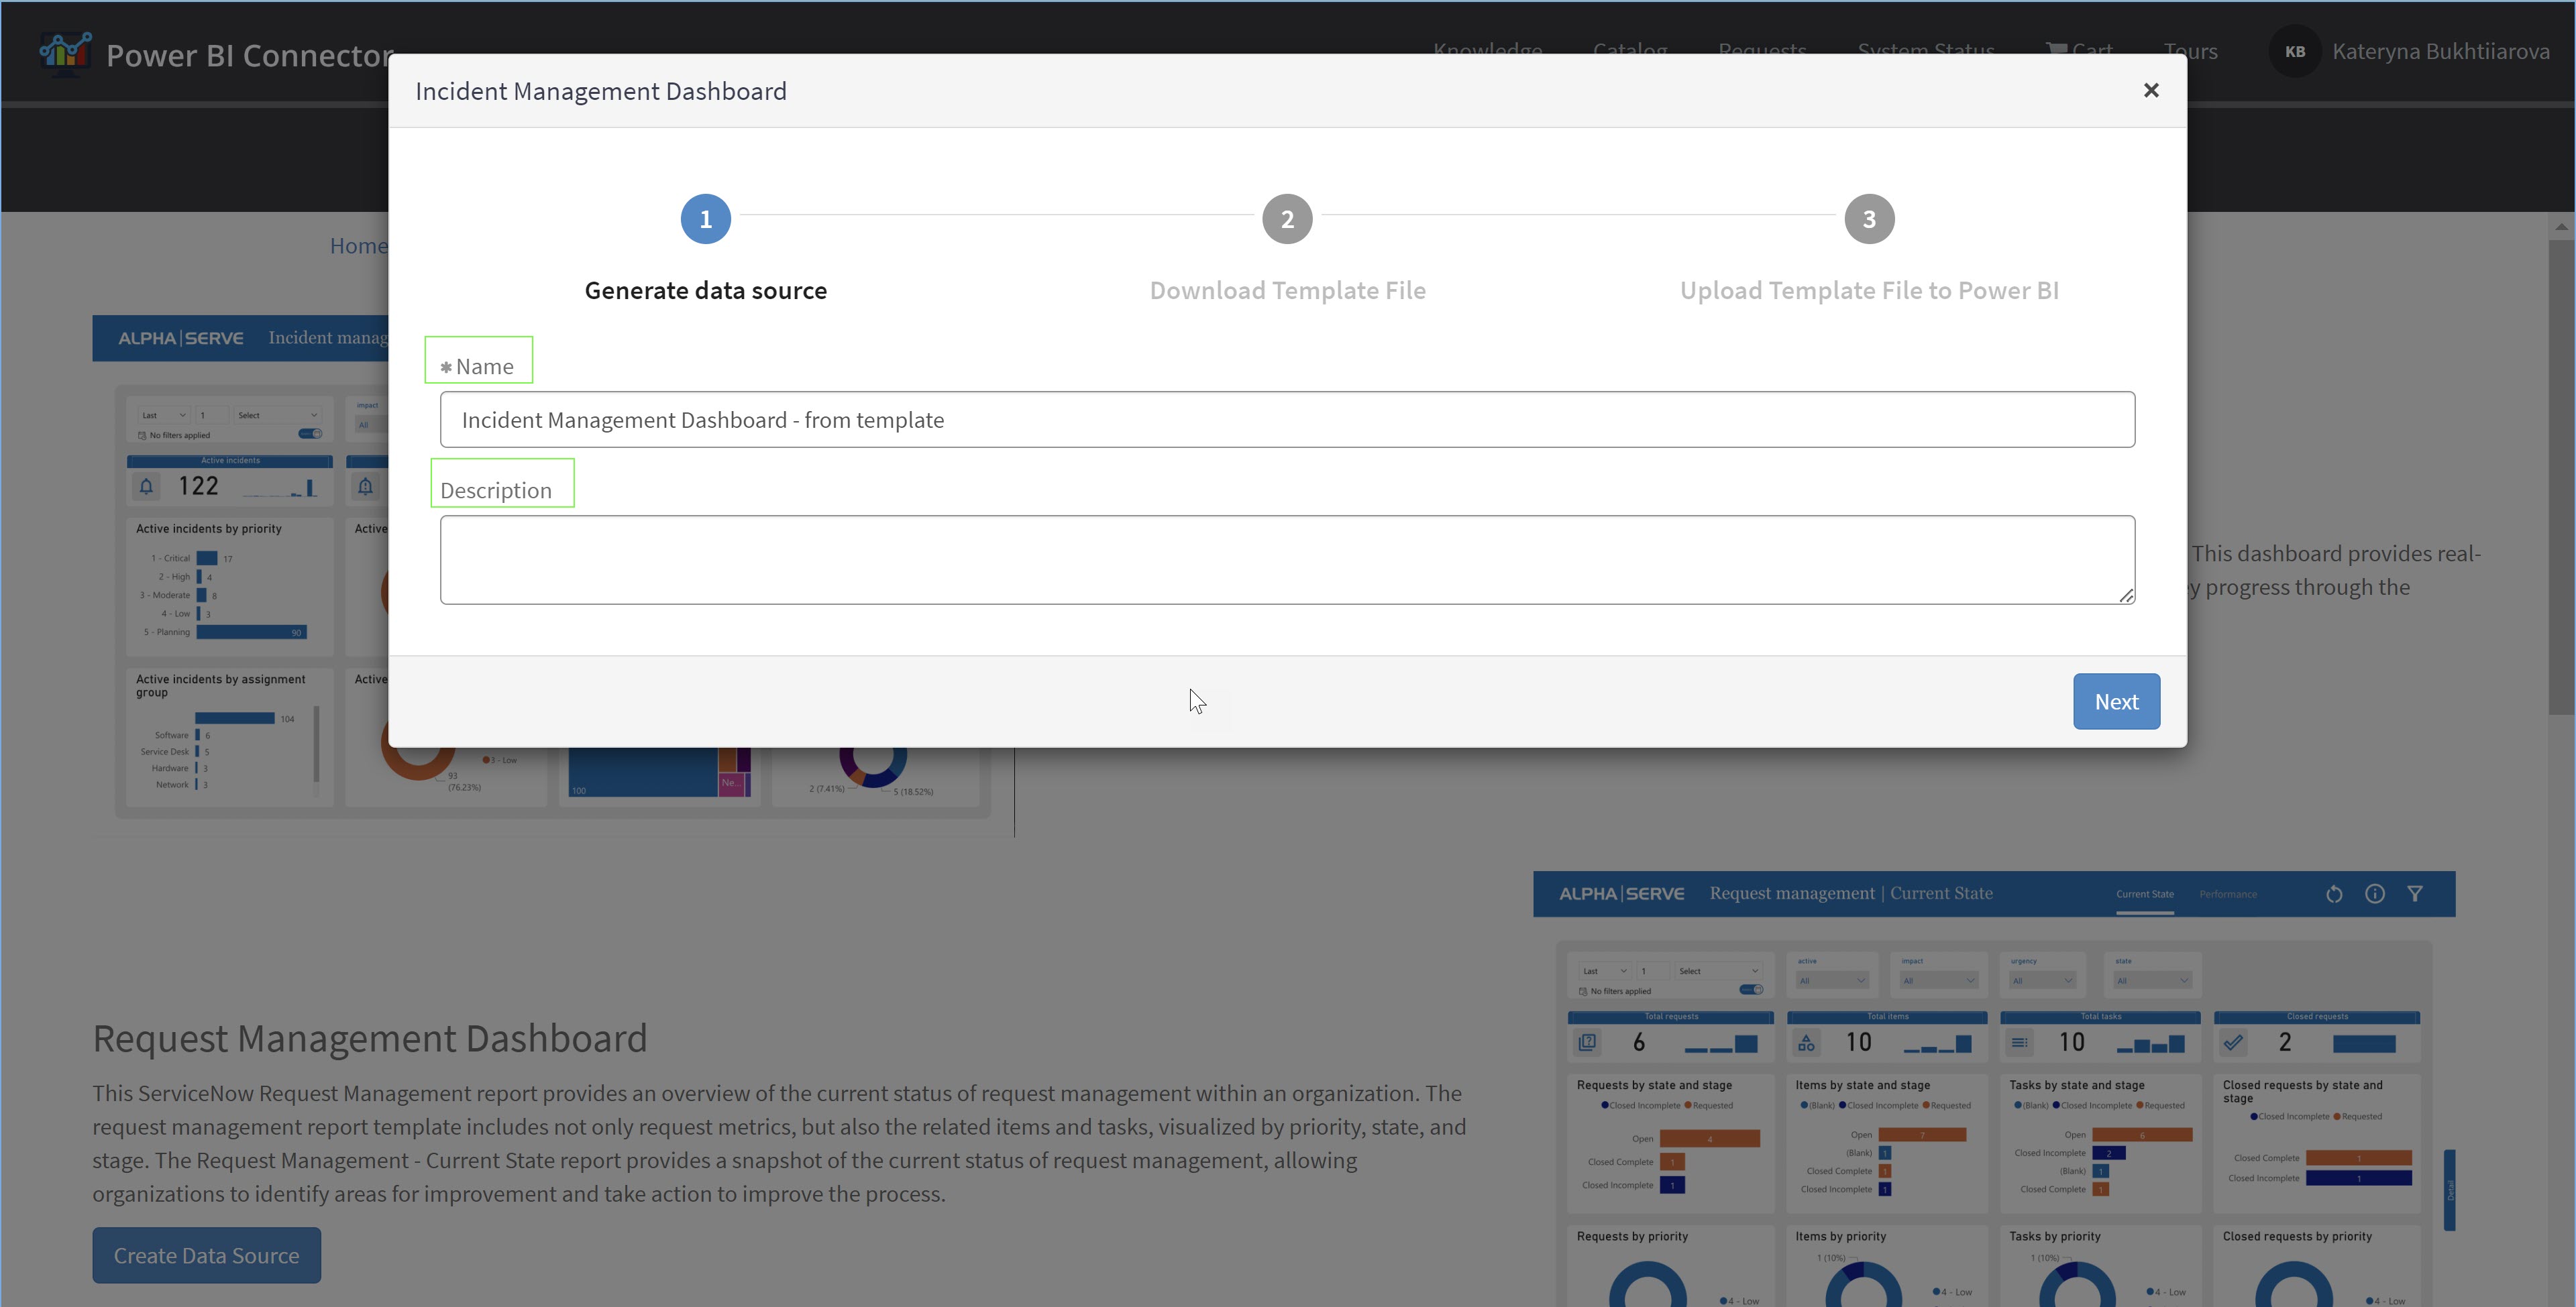
4. Copy the generated data source link and click the Next button to download the .pbit file.
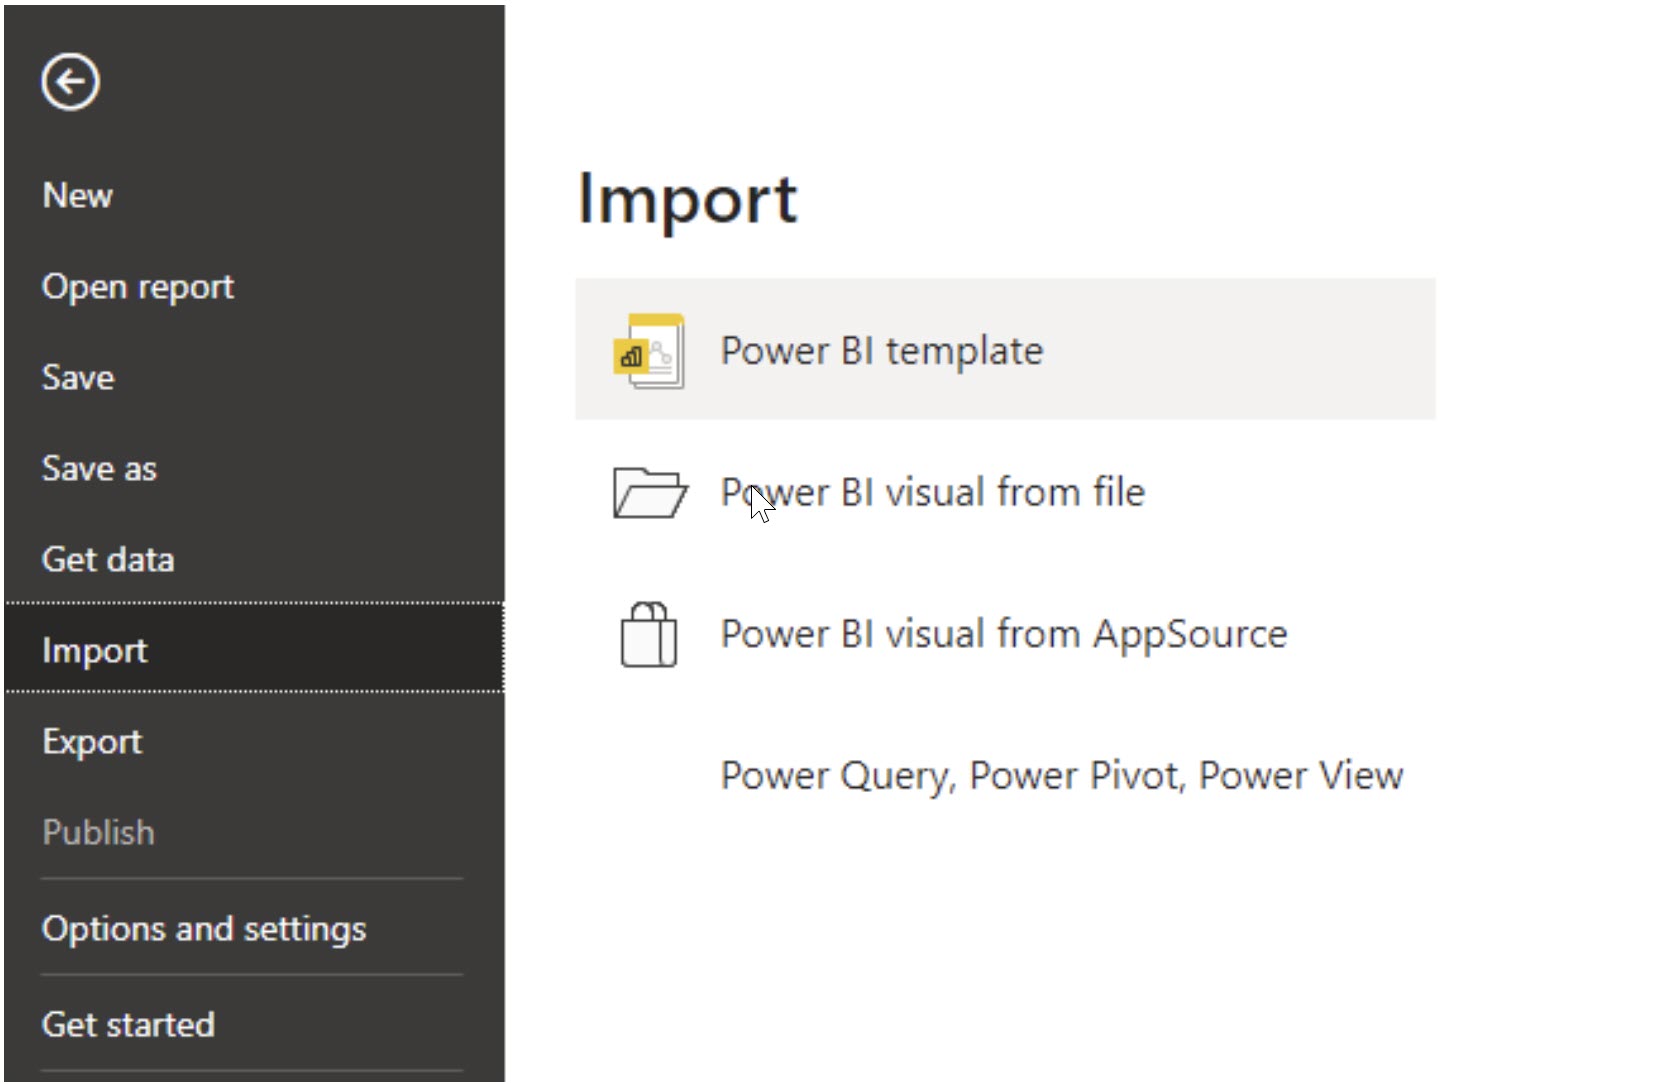
5. Open Power BI Desktop. Go to File > Import > Power BI template and select the .pbit file you’ve downloaded in the previous step.
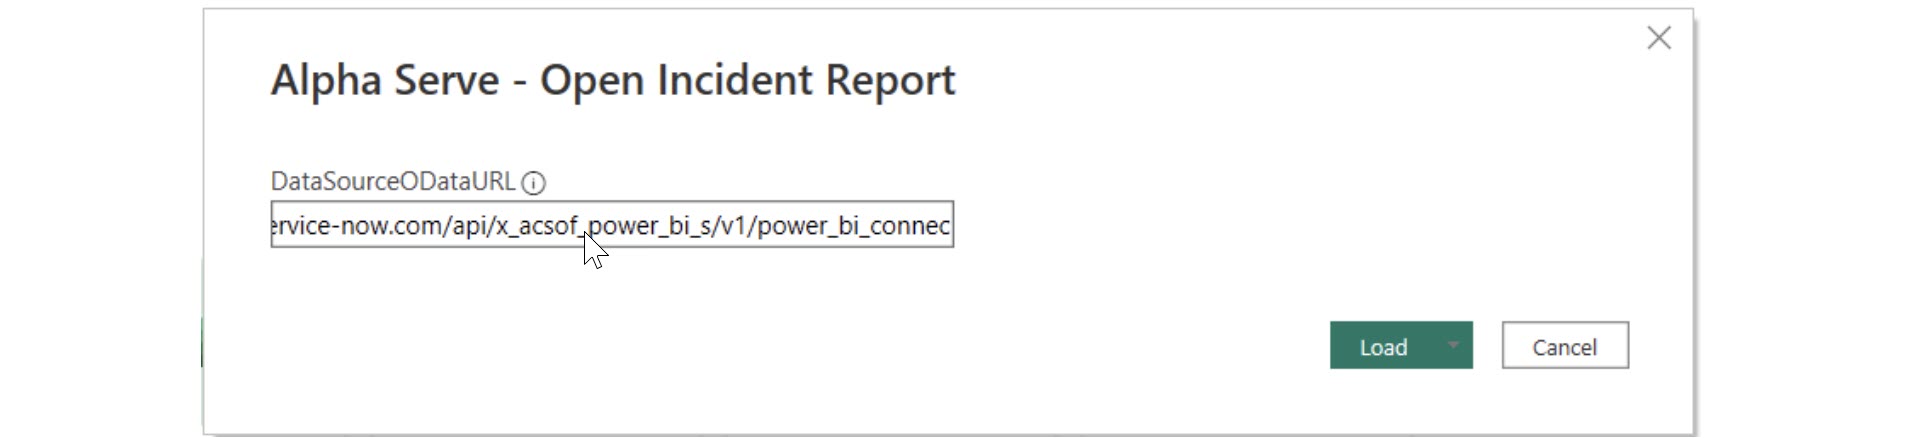
6. Insert a copied Data source URL into the corresponding field.
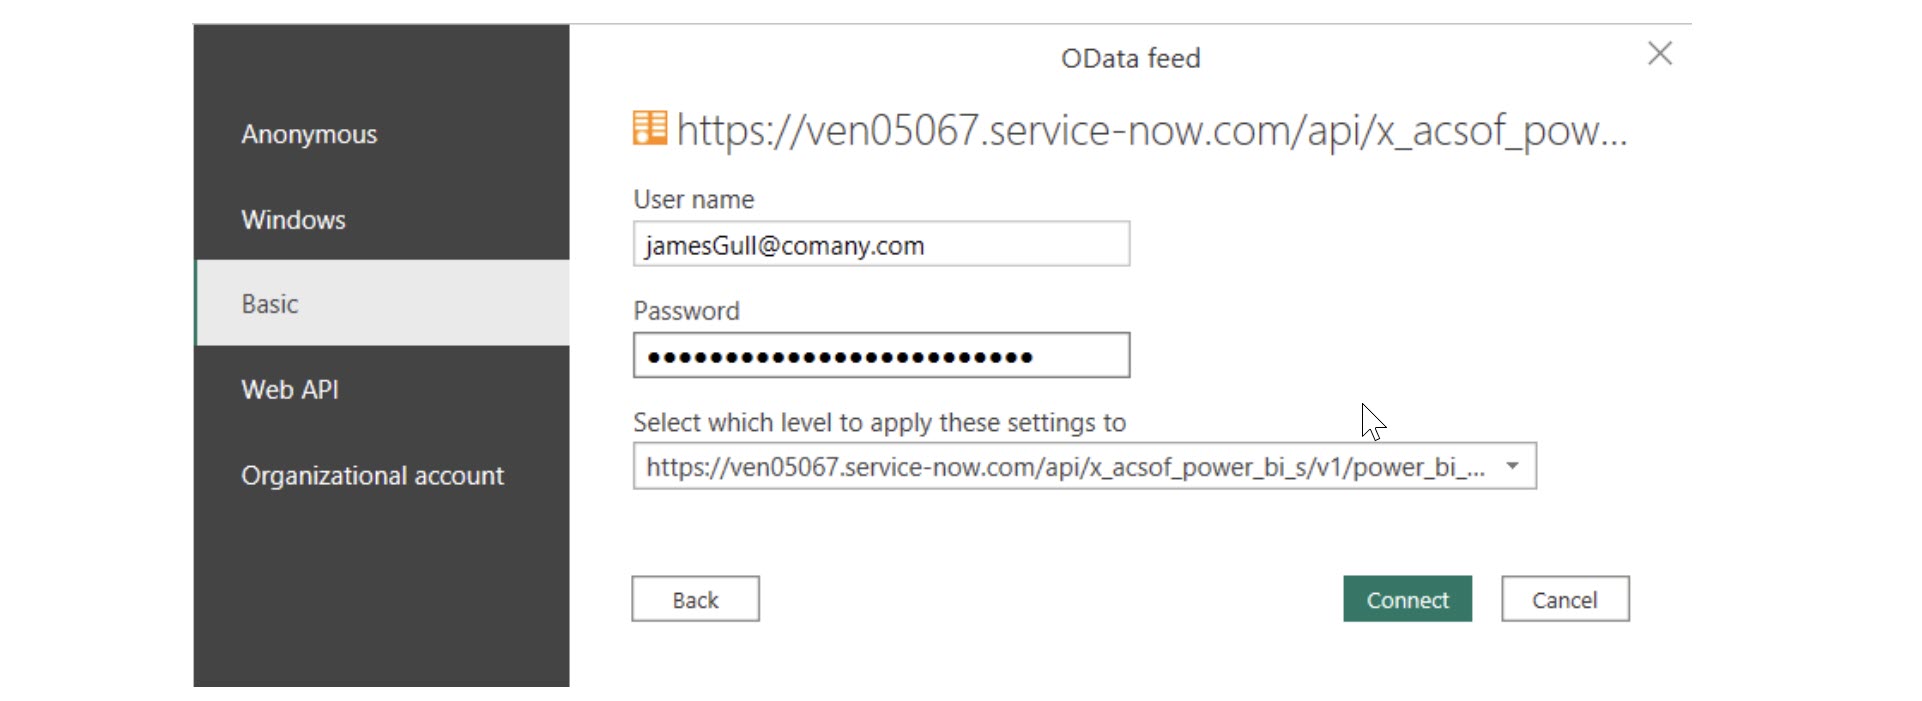
7. Select Basic Authentication and input your credentials. This step is described in more detail in our User Guide: https://aserve.atlassian.net/wiki/spaces/PBISN/pages/2433581072/User+Guide#How-to-import-data-into-Microsoft-Power-BI?
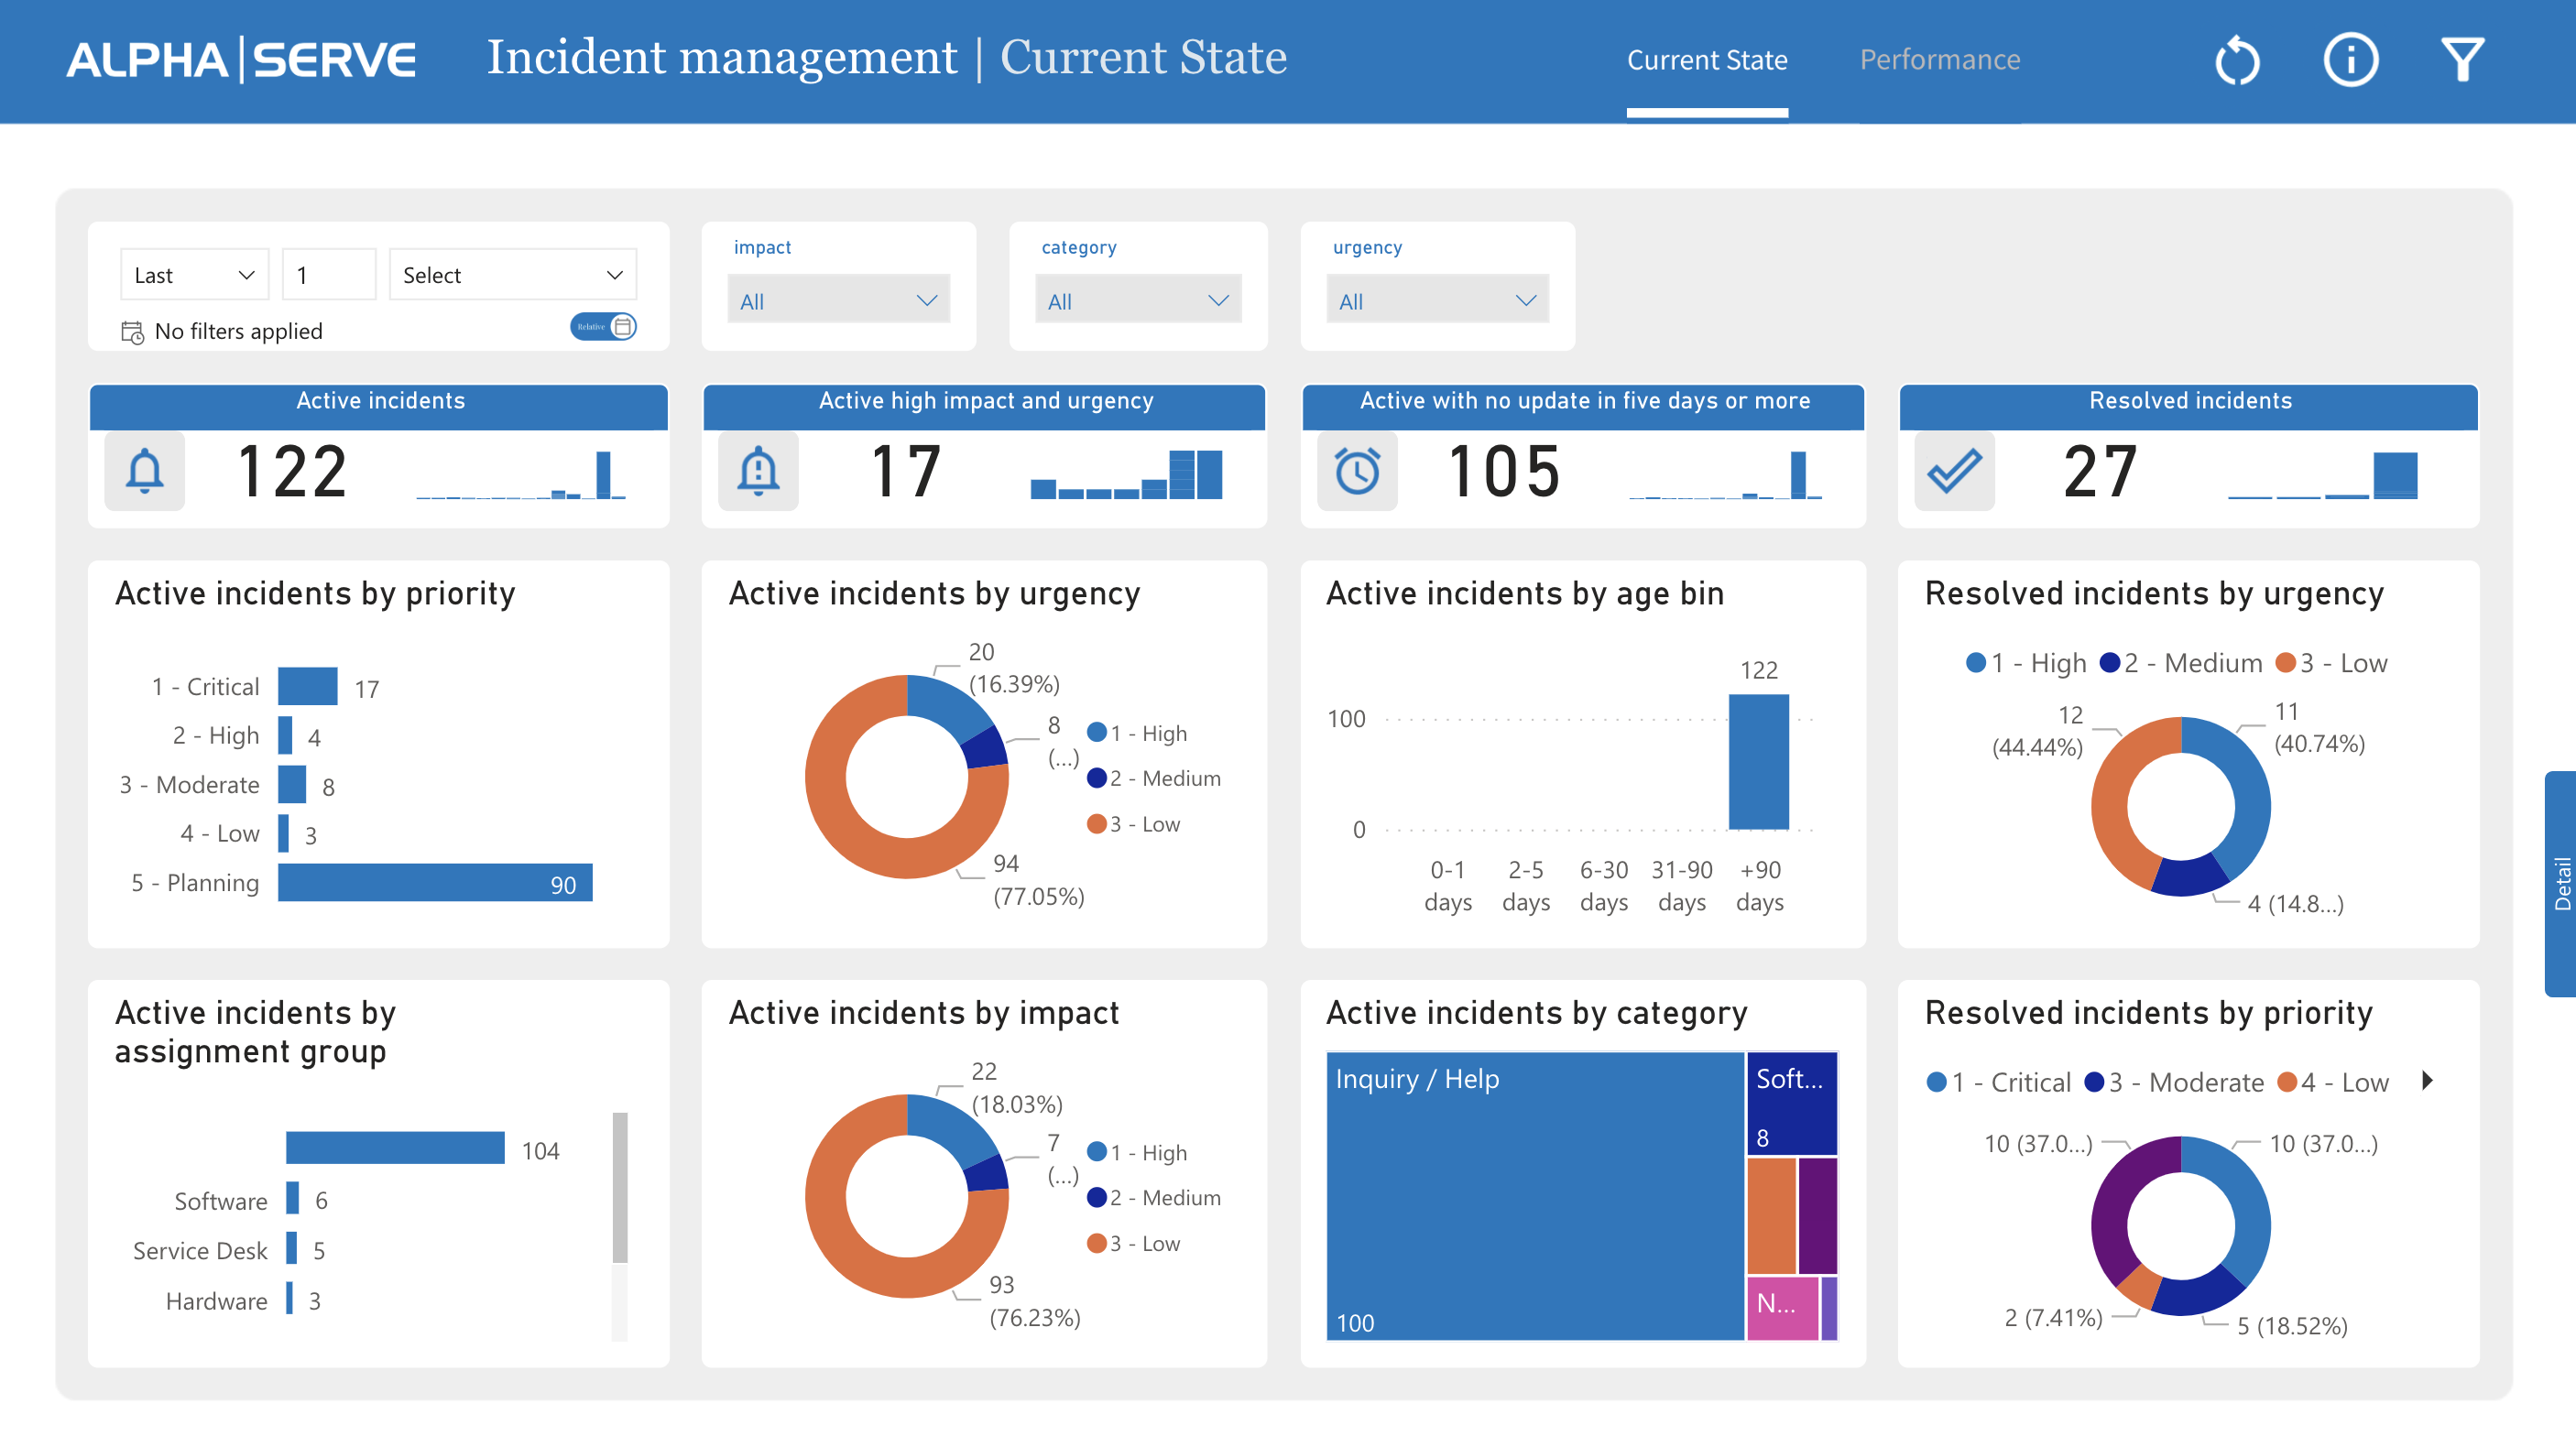
Incident Management - Current State
This incident management report reflect the actual information on the date of report or in the selected time period. This dashboard provides real-time update on incidents as they are raised and resolved, allowing IT teams to monitor the status of incidents as they progress through the resolution process.
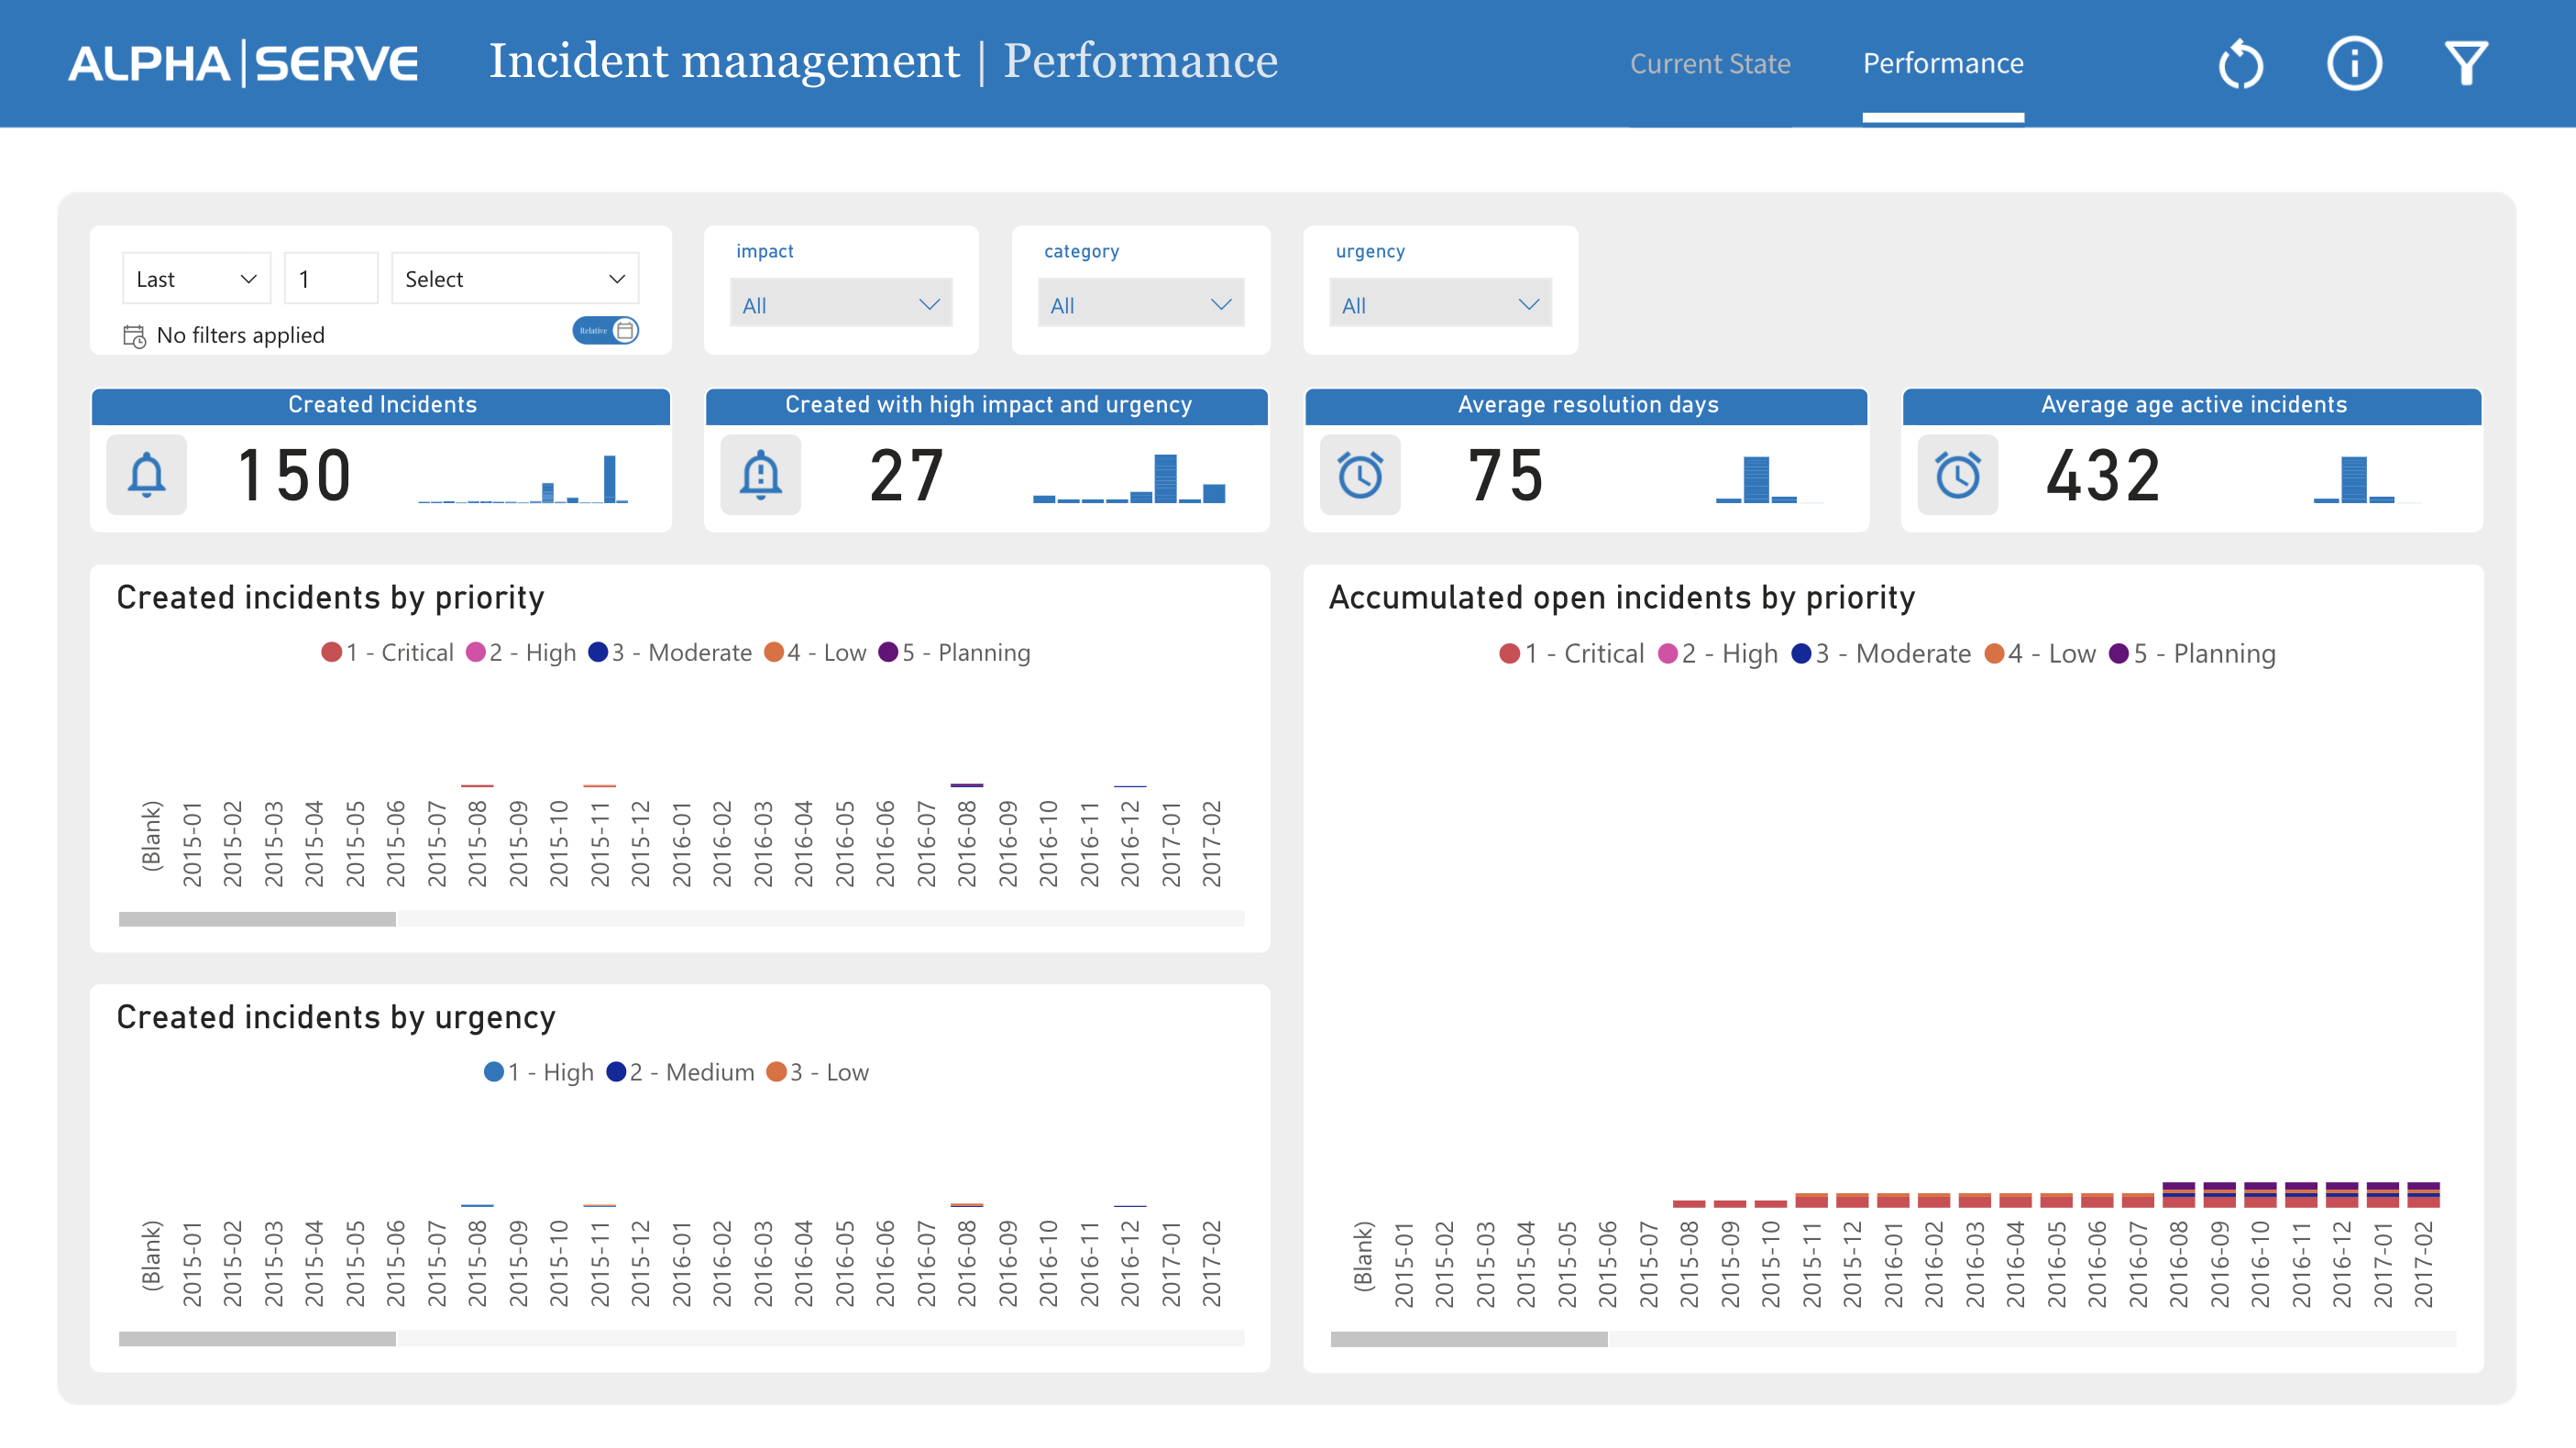
Incident Management - Performance
This incident management report provides graphs and charts that help IT teams analyze incident trends over time, such as the number of incidents raised per day per priority or urgency or the average resolution time. It refers to how effectively an organization is managing its incidents.
By tracking these metrics, organizations can identify areas where they need to improve their incident management process and take actions to improve their performance. This can include investing in additional training and resources for IT staff, implementing new incident management tools and technologies, or making changes to existing incident management procedures
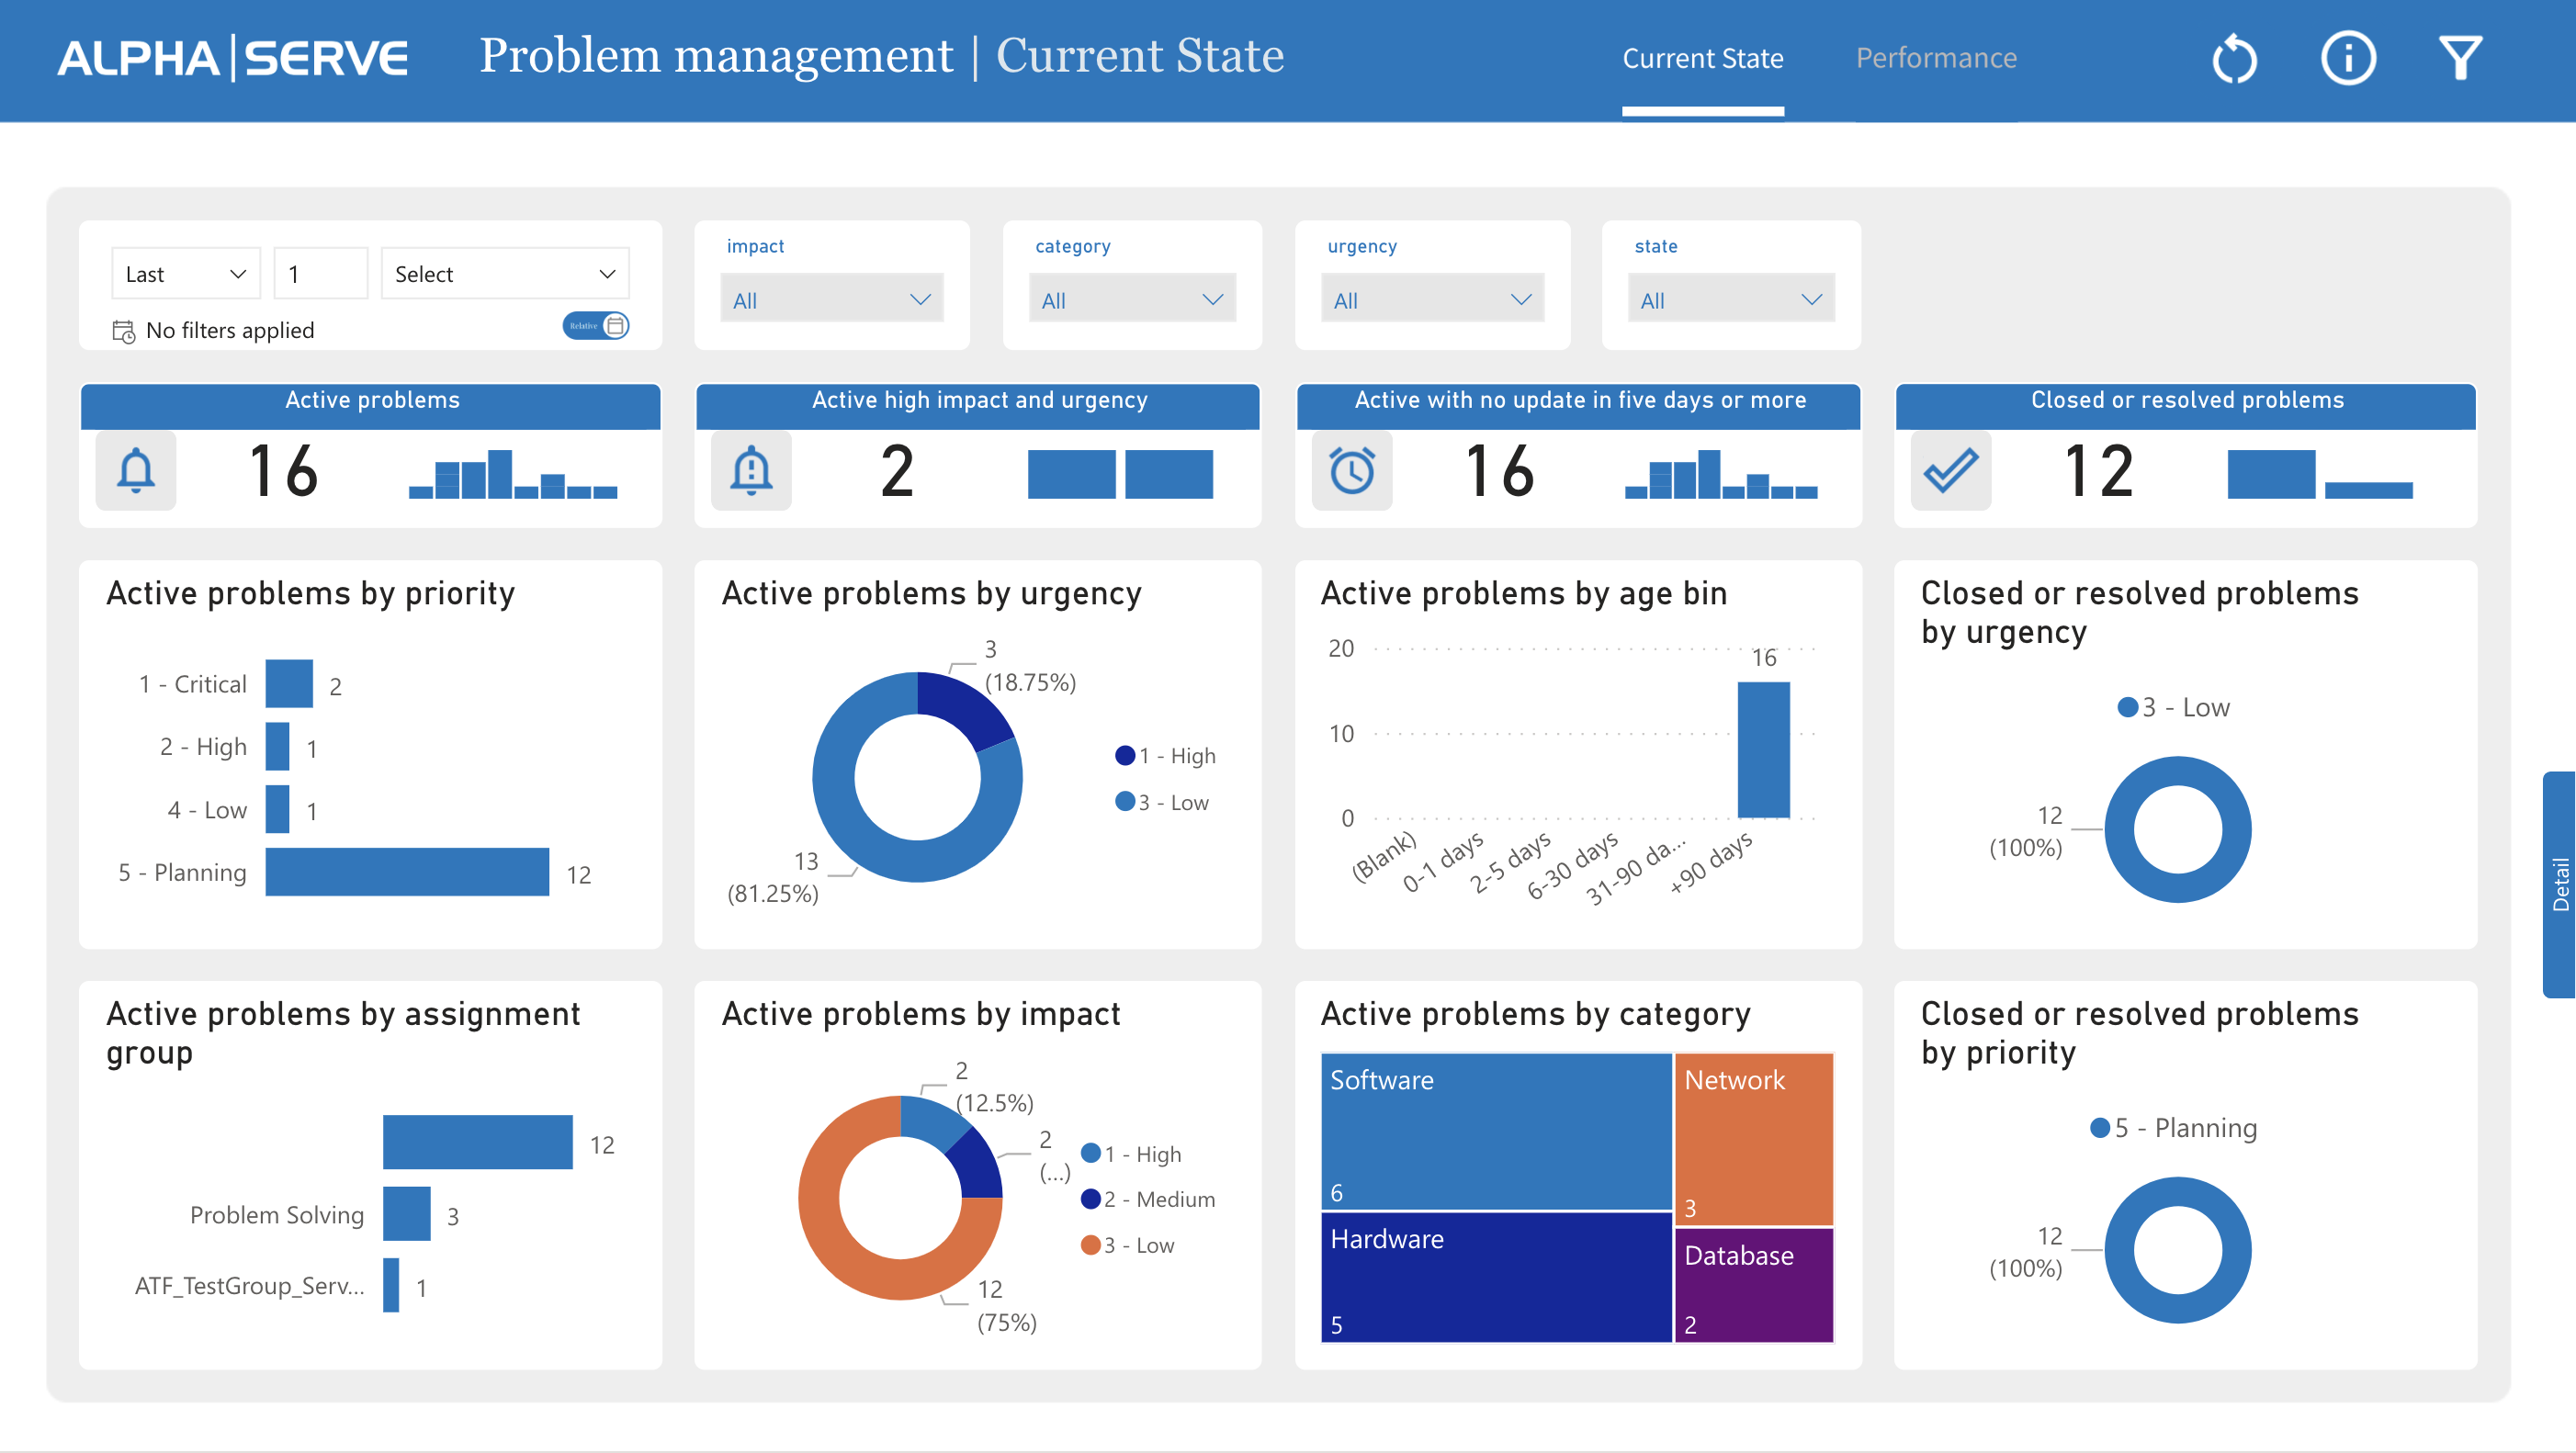
Problem Management - Current State
With real-time problem updates, the dashboard provides up-to-date information on problems as they are identified and resolved. This feature allows IT teams to track the progress of problems as they move through the resolution process, providing a comprehensive overview of the current status of each problem.
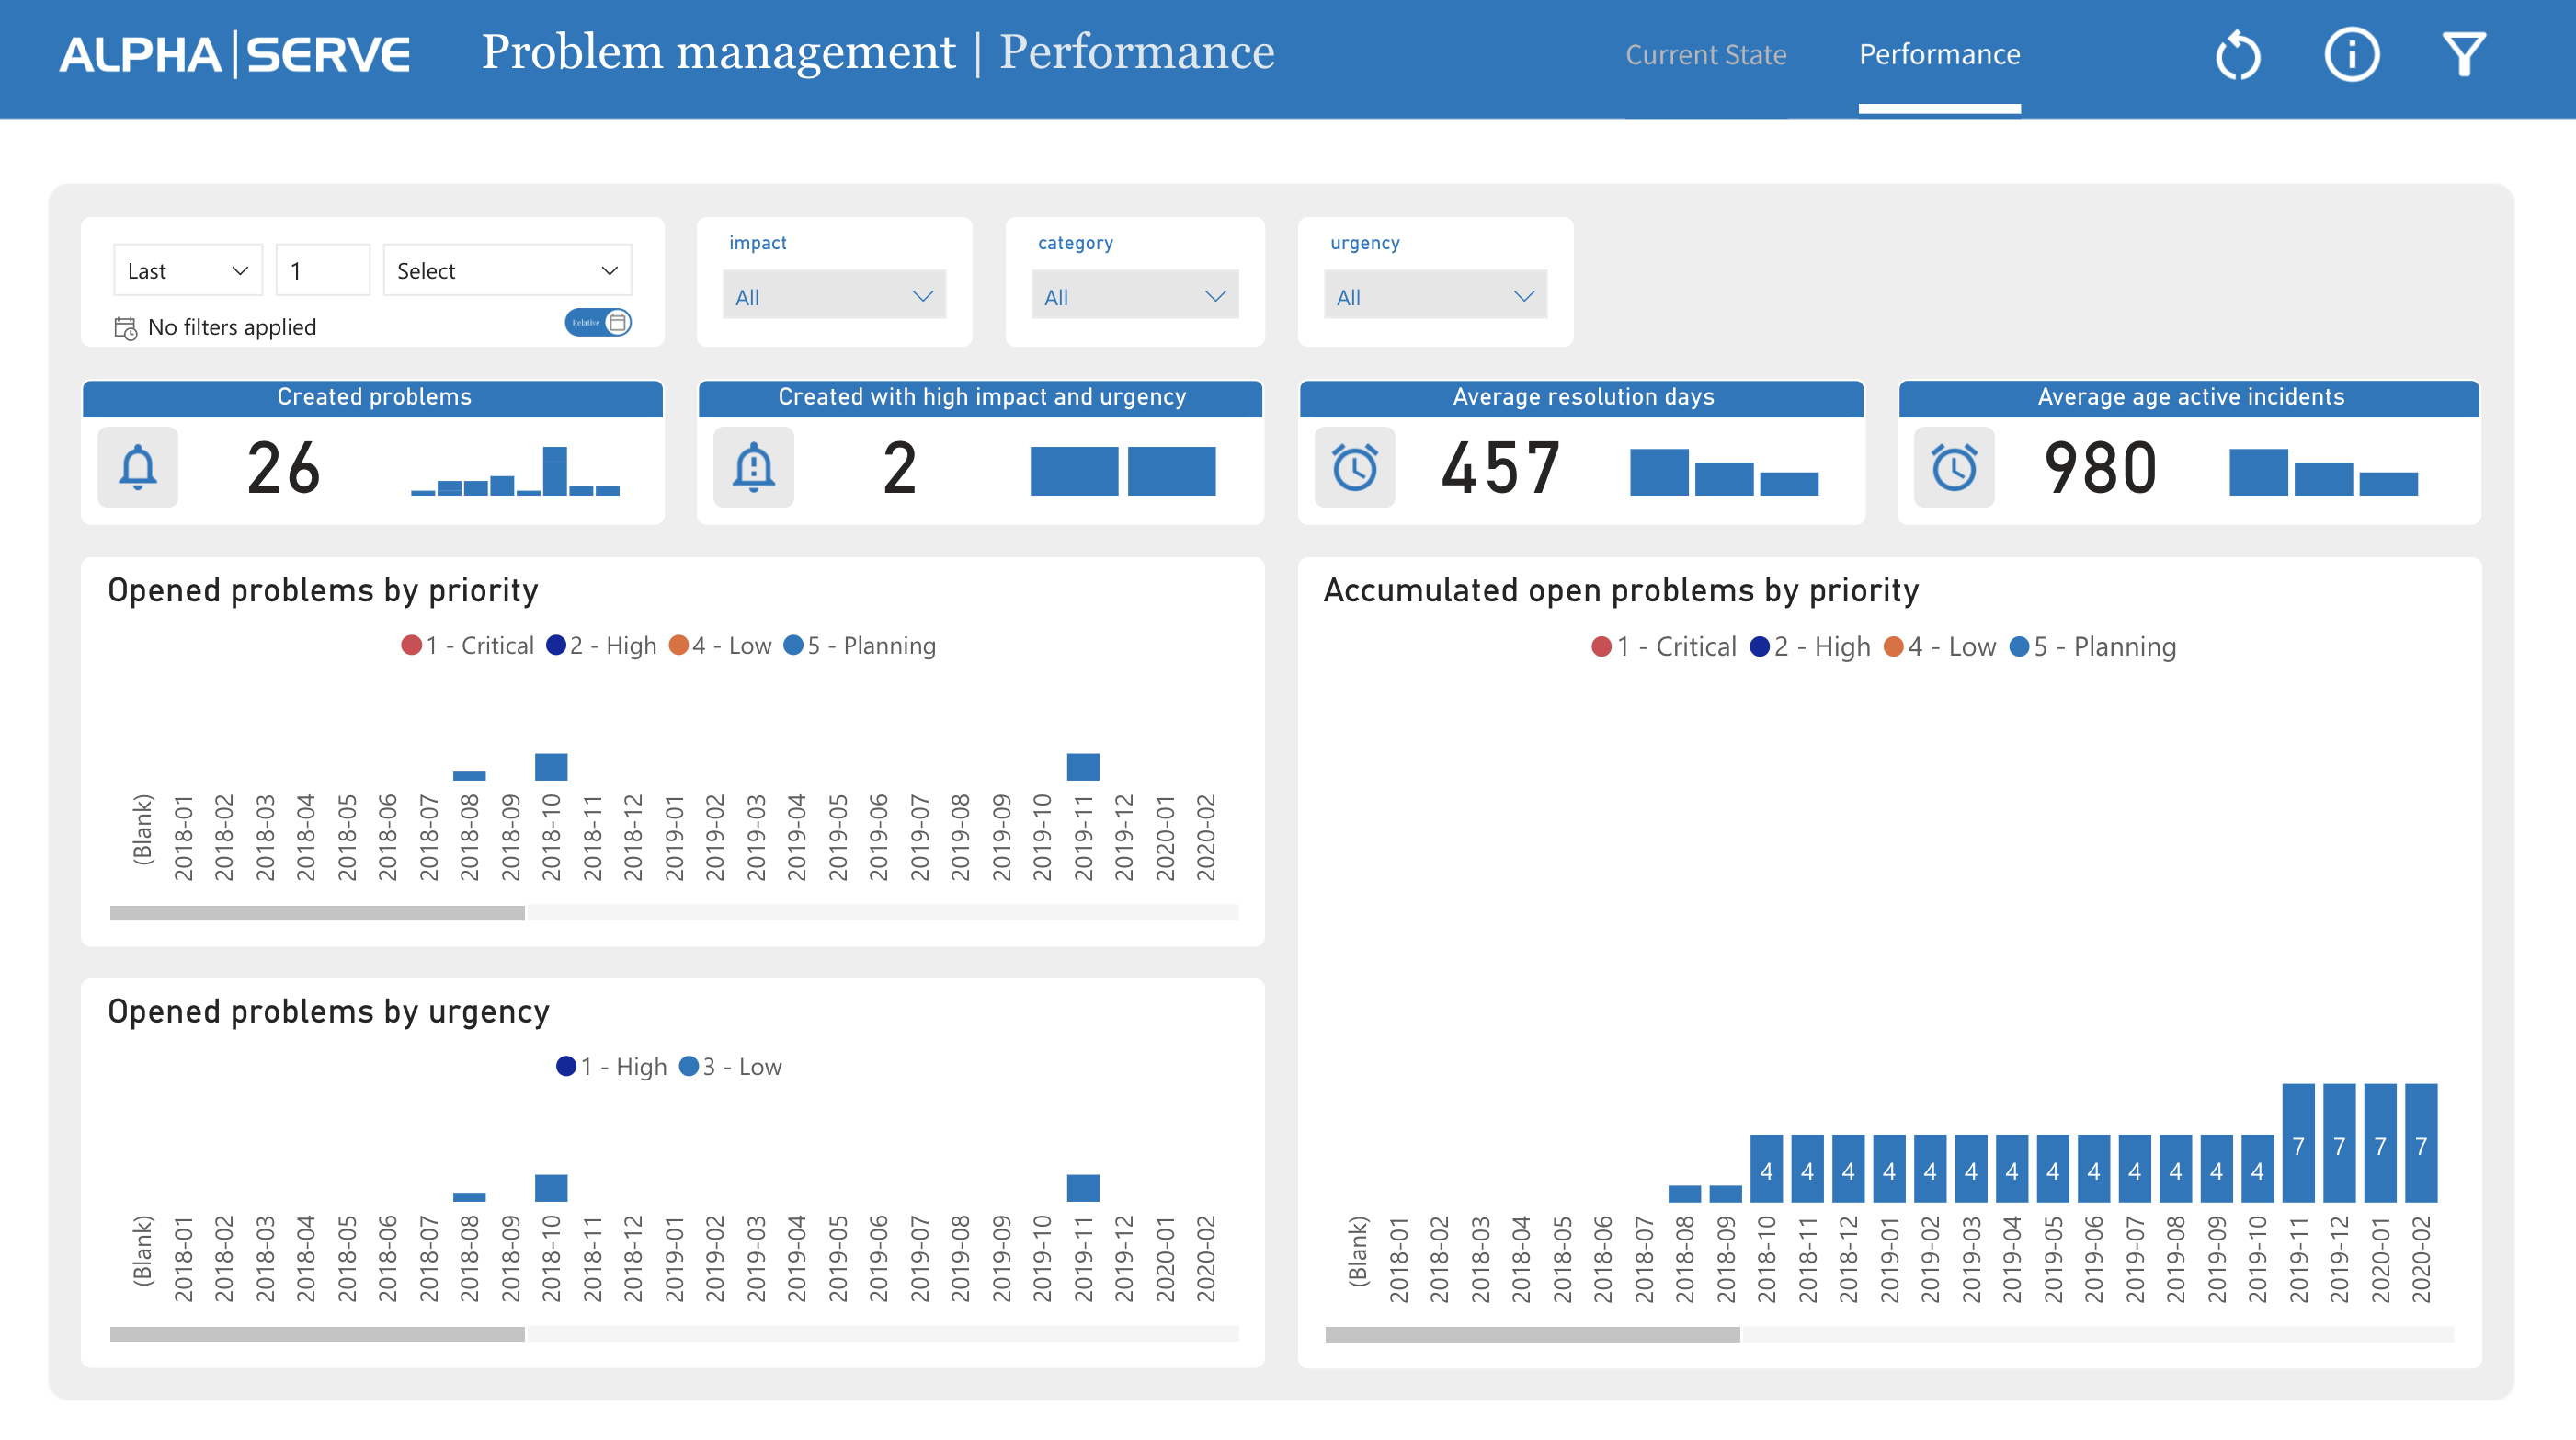
Problem Management - Performance
The problem management in ServiceNow dashboard's problem trend analysis feature utilizes graphs and charts to help IT teams analyze problem trends over time. By tracking metrics such as the number of problems identified per day and the average time taken to resolve problems, IT teams can gain insights into the effectiveness of their problem management process and identify areas for improvement.
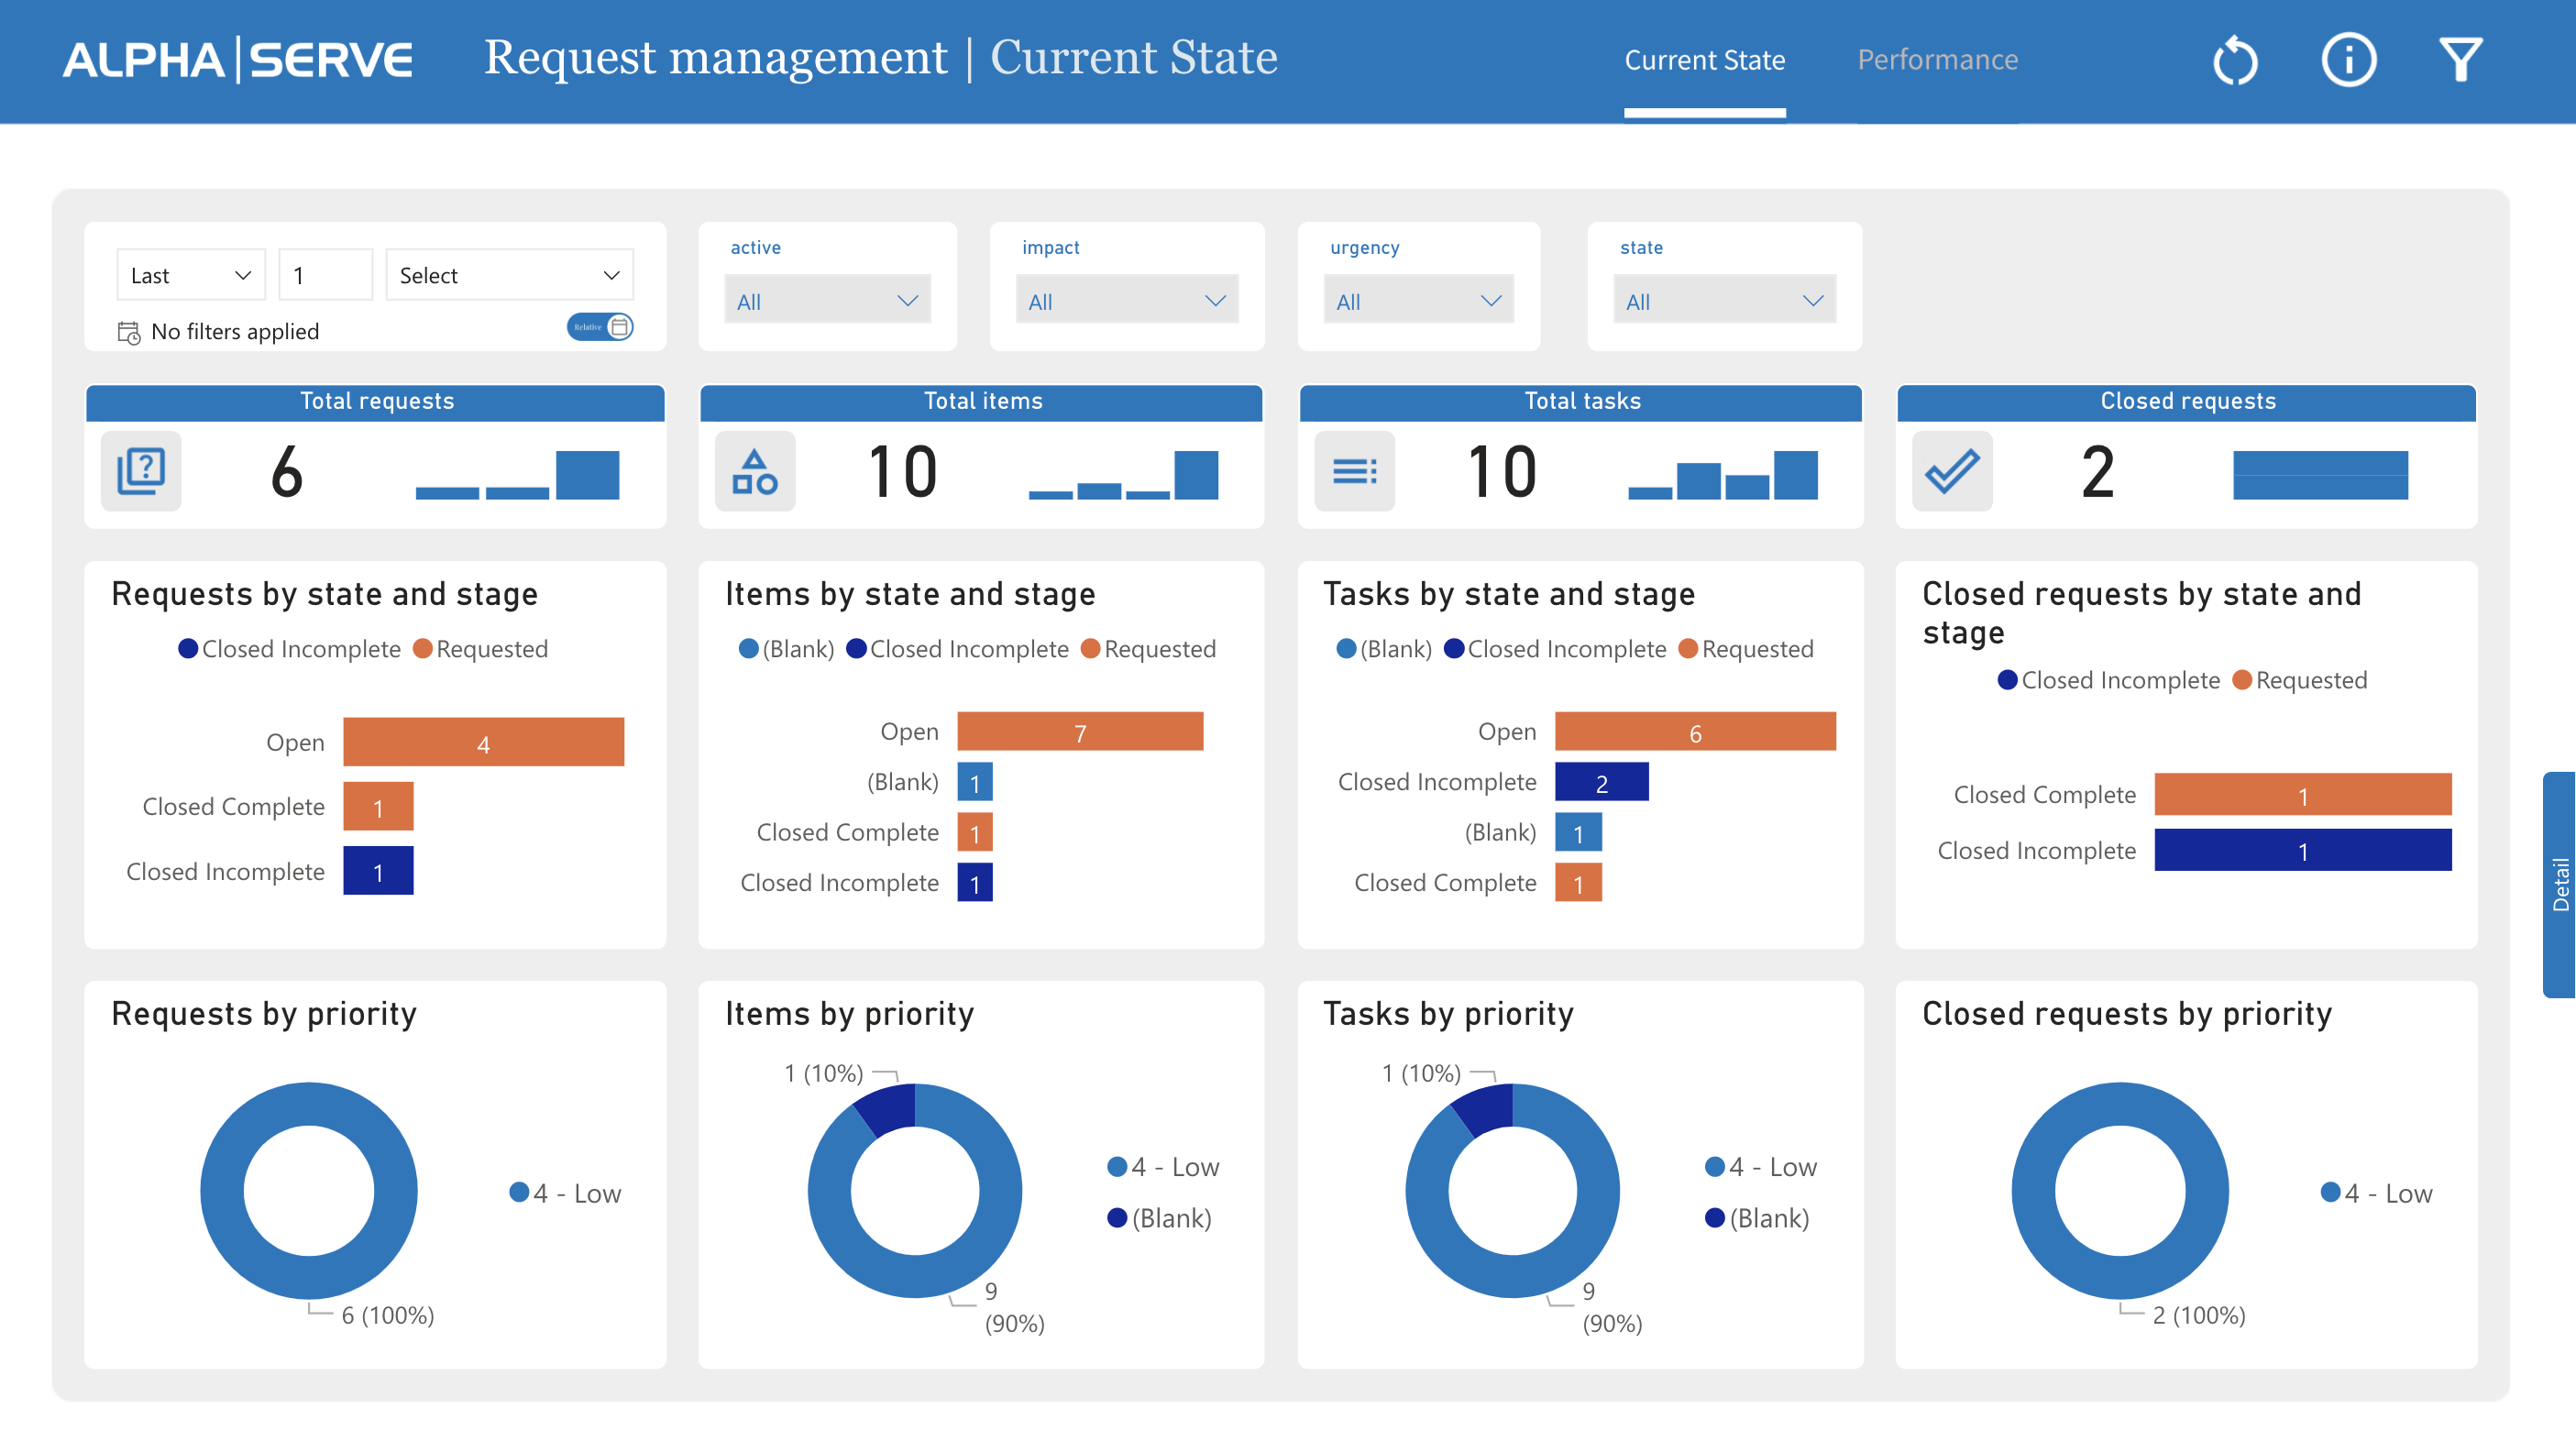
Request Management - Current State
This ServiceNow Request Management report provides an overview of the current status of request management within an organization.
Request management report template includes not only request metrics, but also the related items and tasks, vizualized by priority, state, and stage.
The Request Management - Current State report provides a snapshot of the current status of request management, allowing organizations to identify areas for improvement and take action to improve the process.
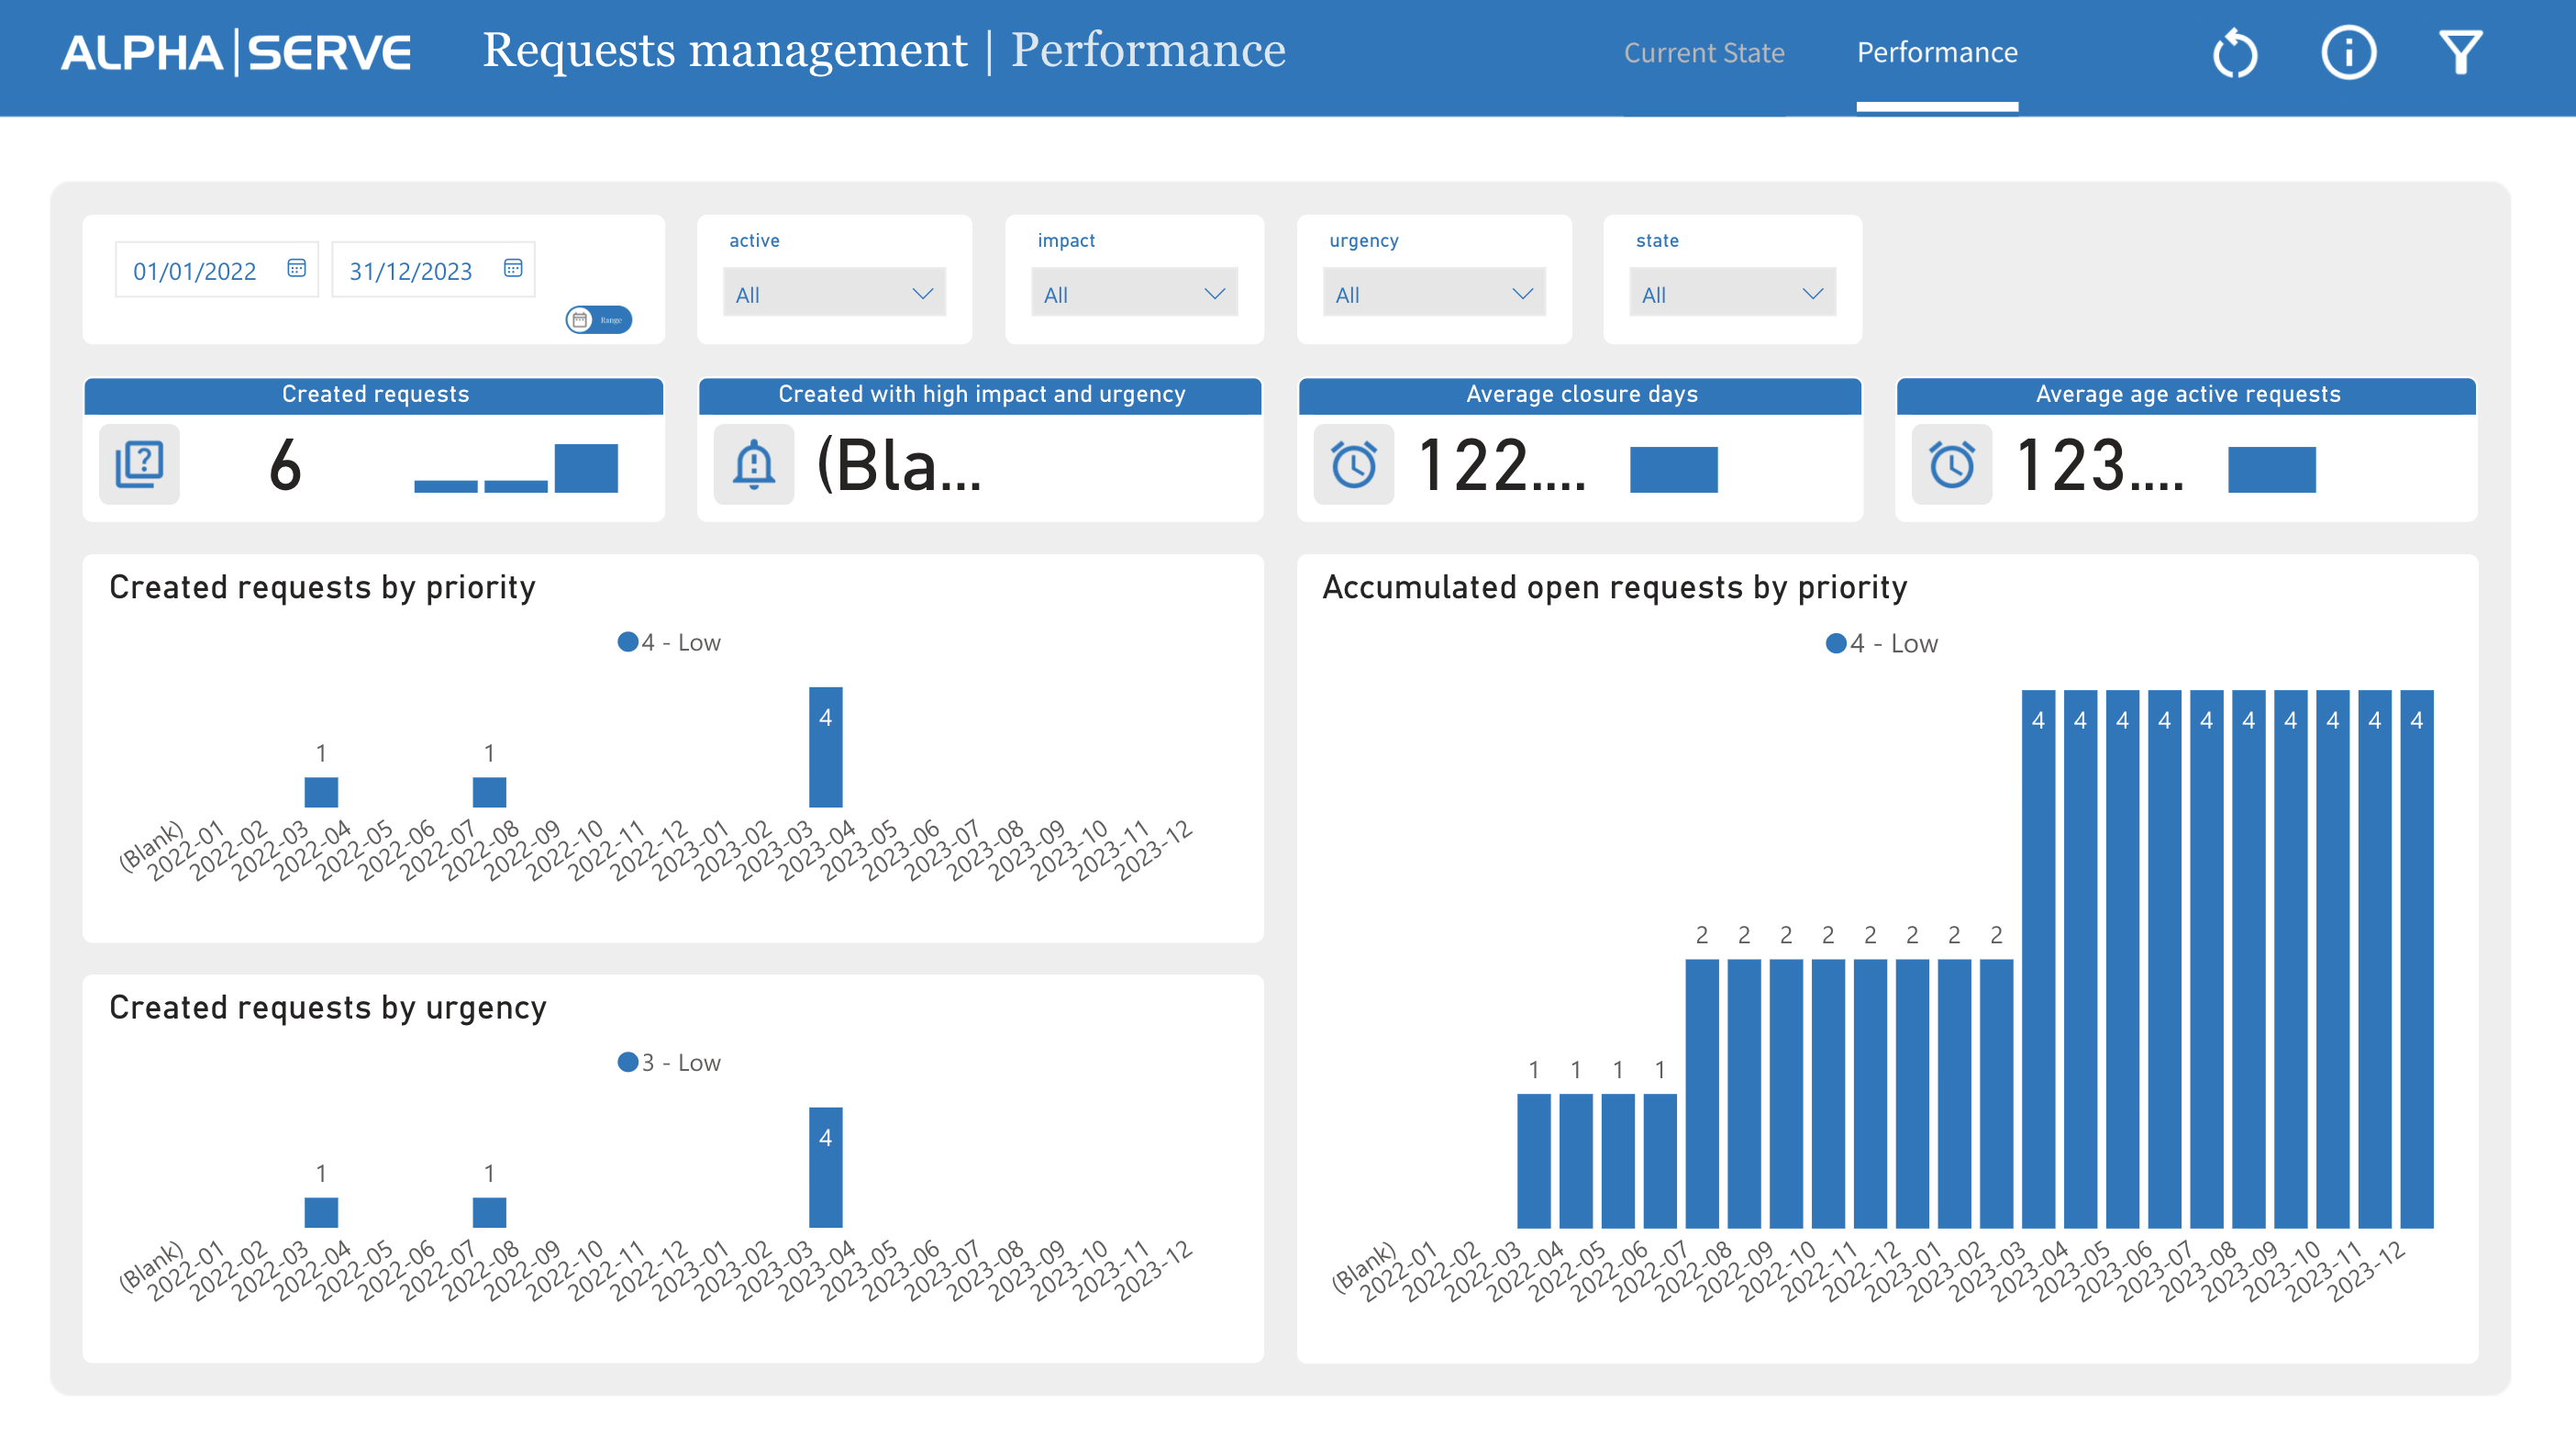
Request Management - Performance
The Performance tab for the ServiceNow request management report shows the requests within a defined period of time, including the accumulated requests.
By using this report to track performance over time, organizations can identify trends and make data-driven decisions to optimize the request management process and improve service to end-users.
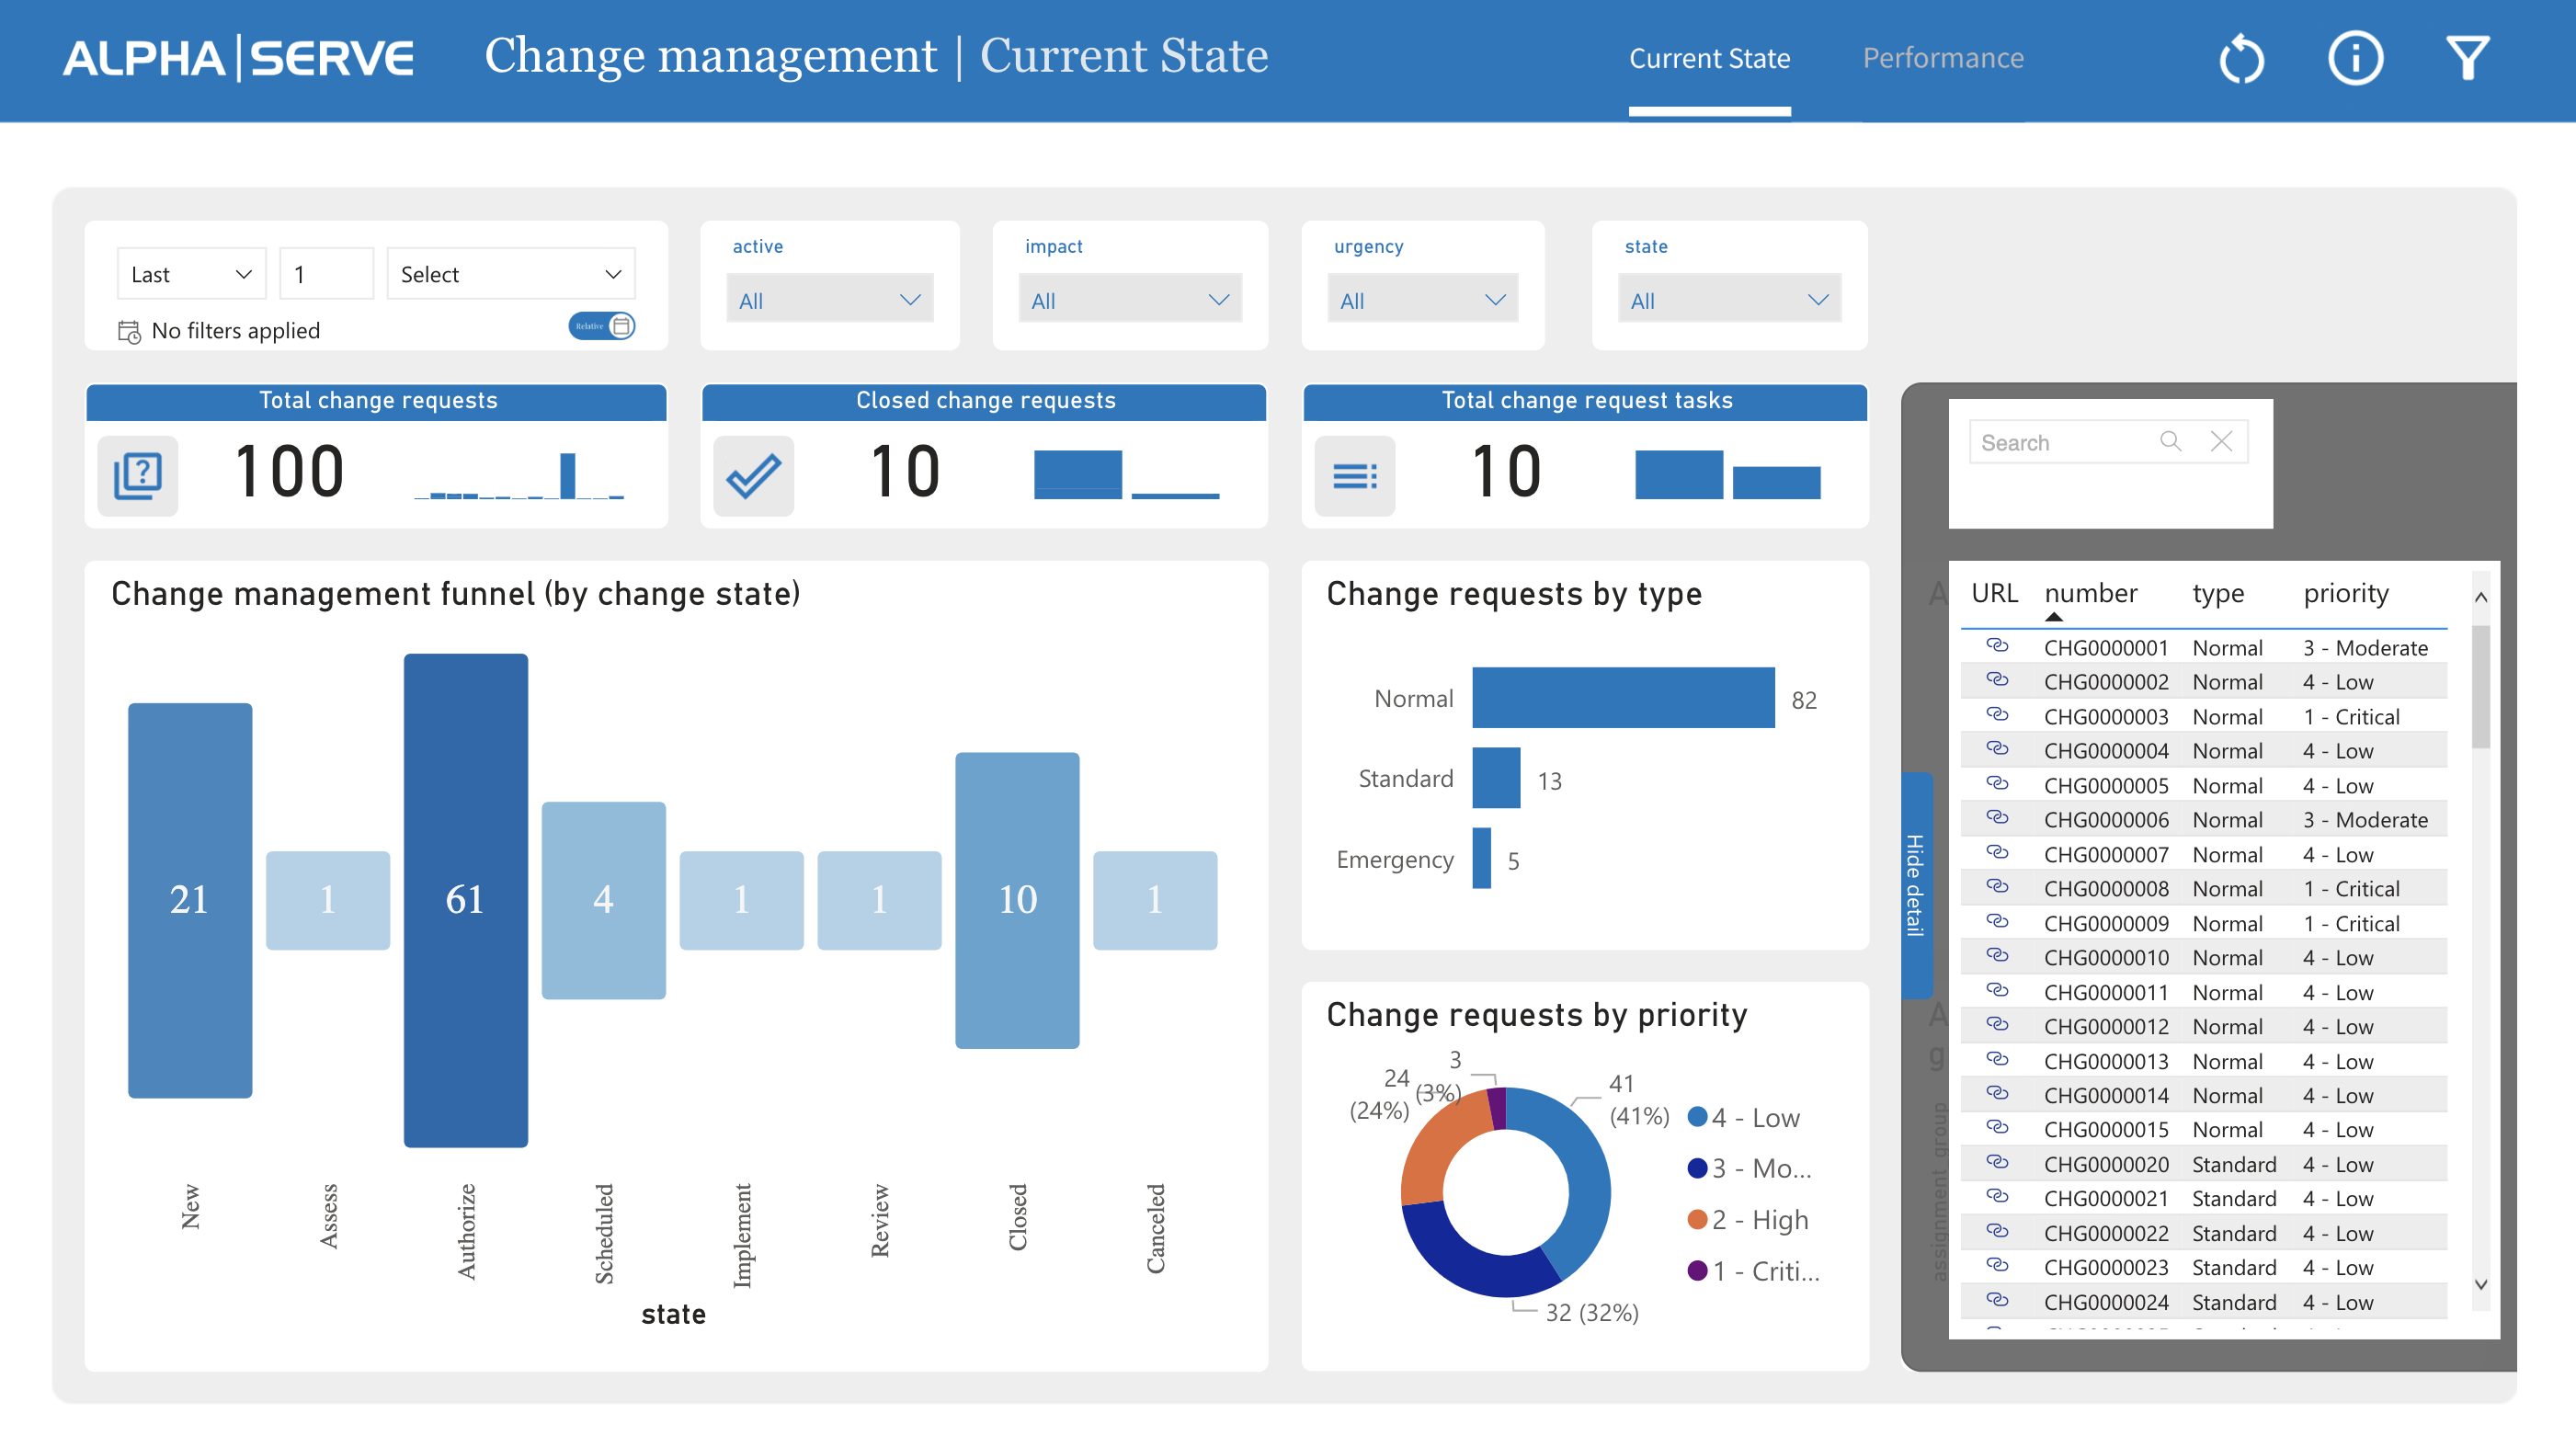
Change Management - Current State
The ServiceNow change management report dashboard provides an overview of all change requests, including their status, priority, and impact.
The template allows to build your ServiceNow change management funnel. It is a visual representation of the stages in the change management process within the ServiceNow platform. It is used to track and manage changes from the initial request through to implementation and review. The change management funnel provides a clear and structured way to manage changes and ensure that they are implemented effectively and efficiently.
Change Management - Performance
The Performance tab for the ServiceNow change management report provides an overview of the performance of the change management process within an organization. The Alpha Serve’s report template includes metrics and key performance indicators (KPIs) that are used to measure the effectiveness and efficiency of the change management process, such as changes by priority and urgency, average closure days, and average age for active requests. Additionally, it covers the accumulated open change requests by priority.
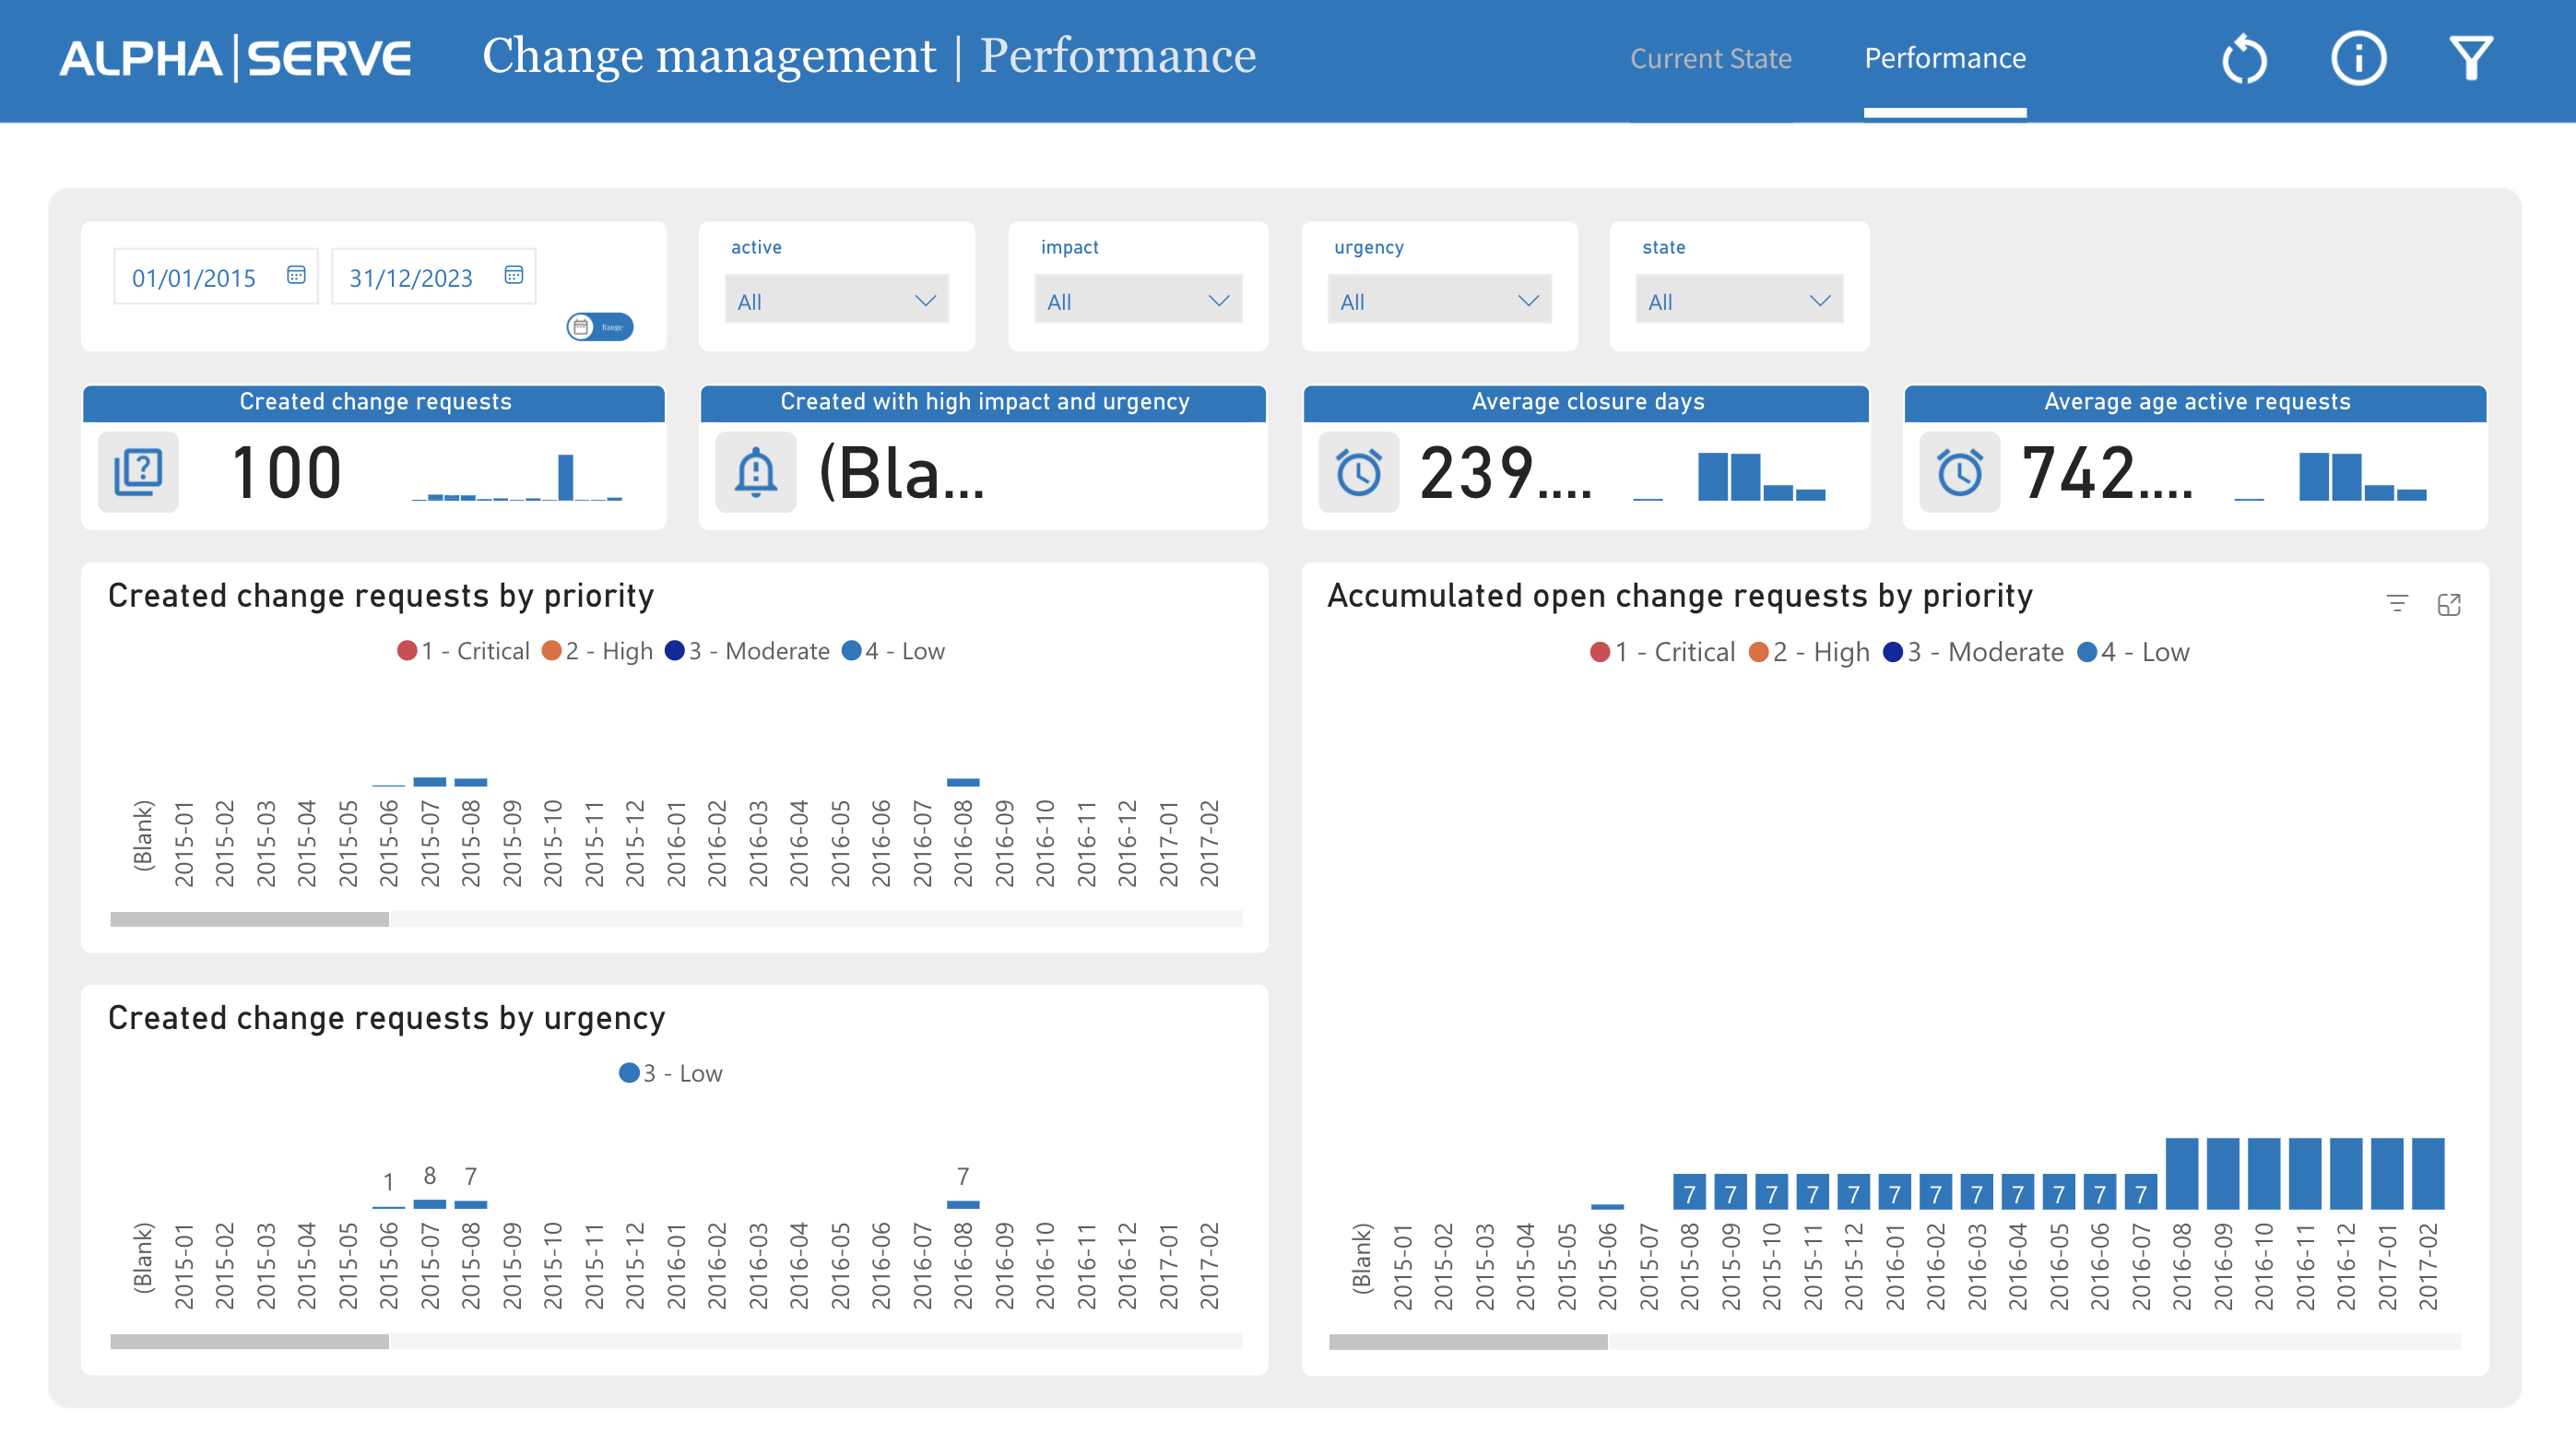
NOTE: Please pay attention to be able to see and create Change Management template user has to be Admin or at least has role sttrm_admin
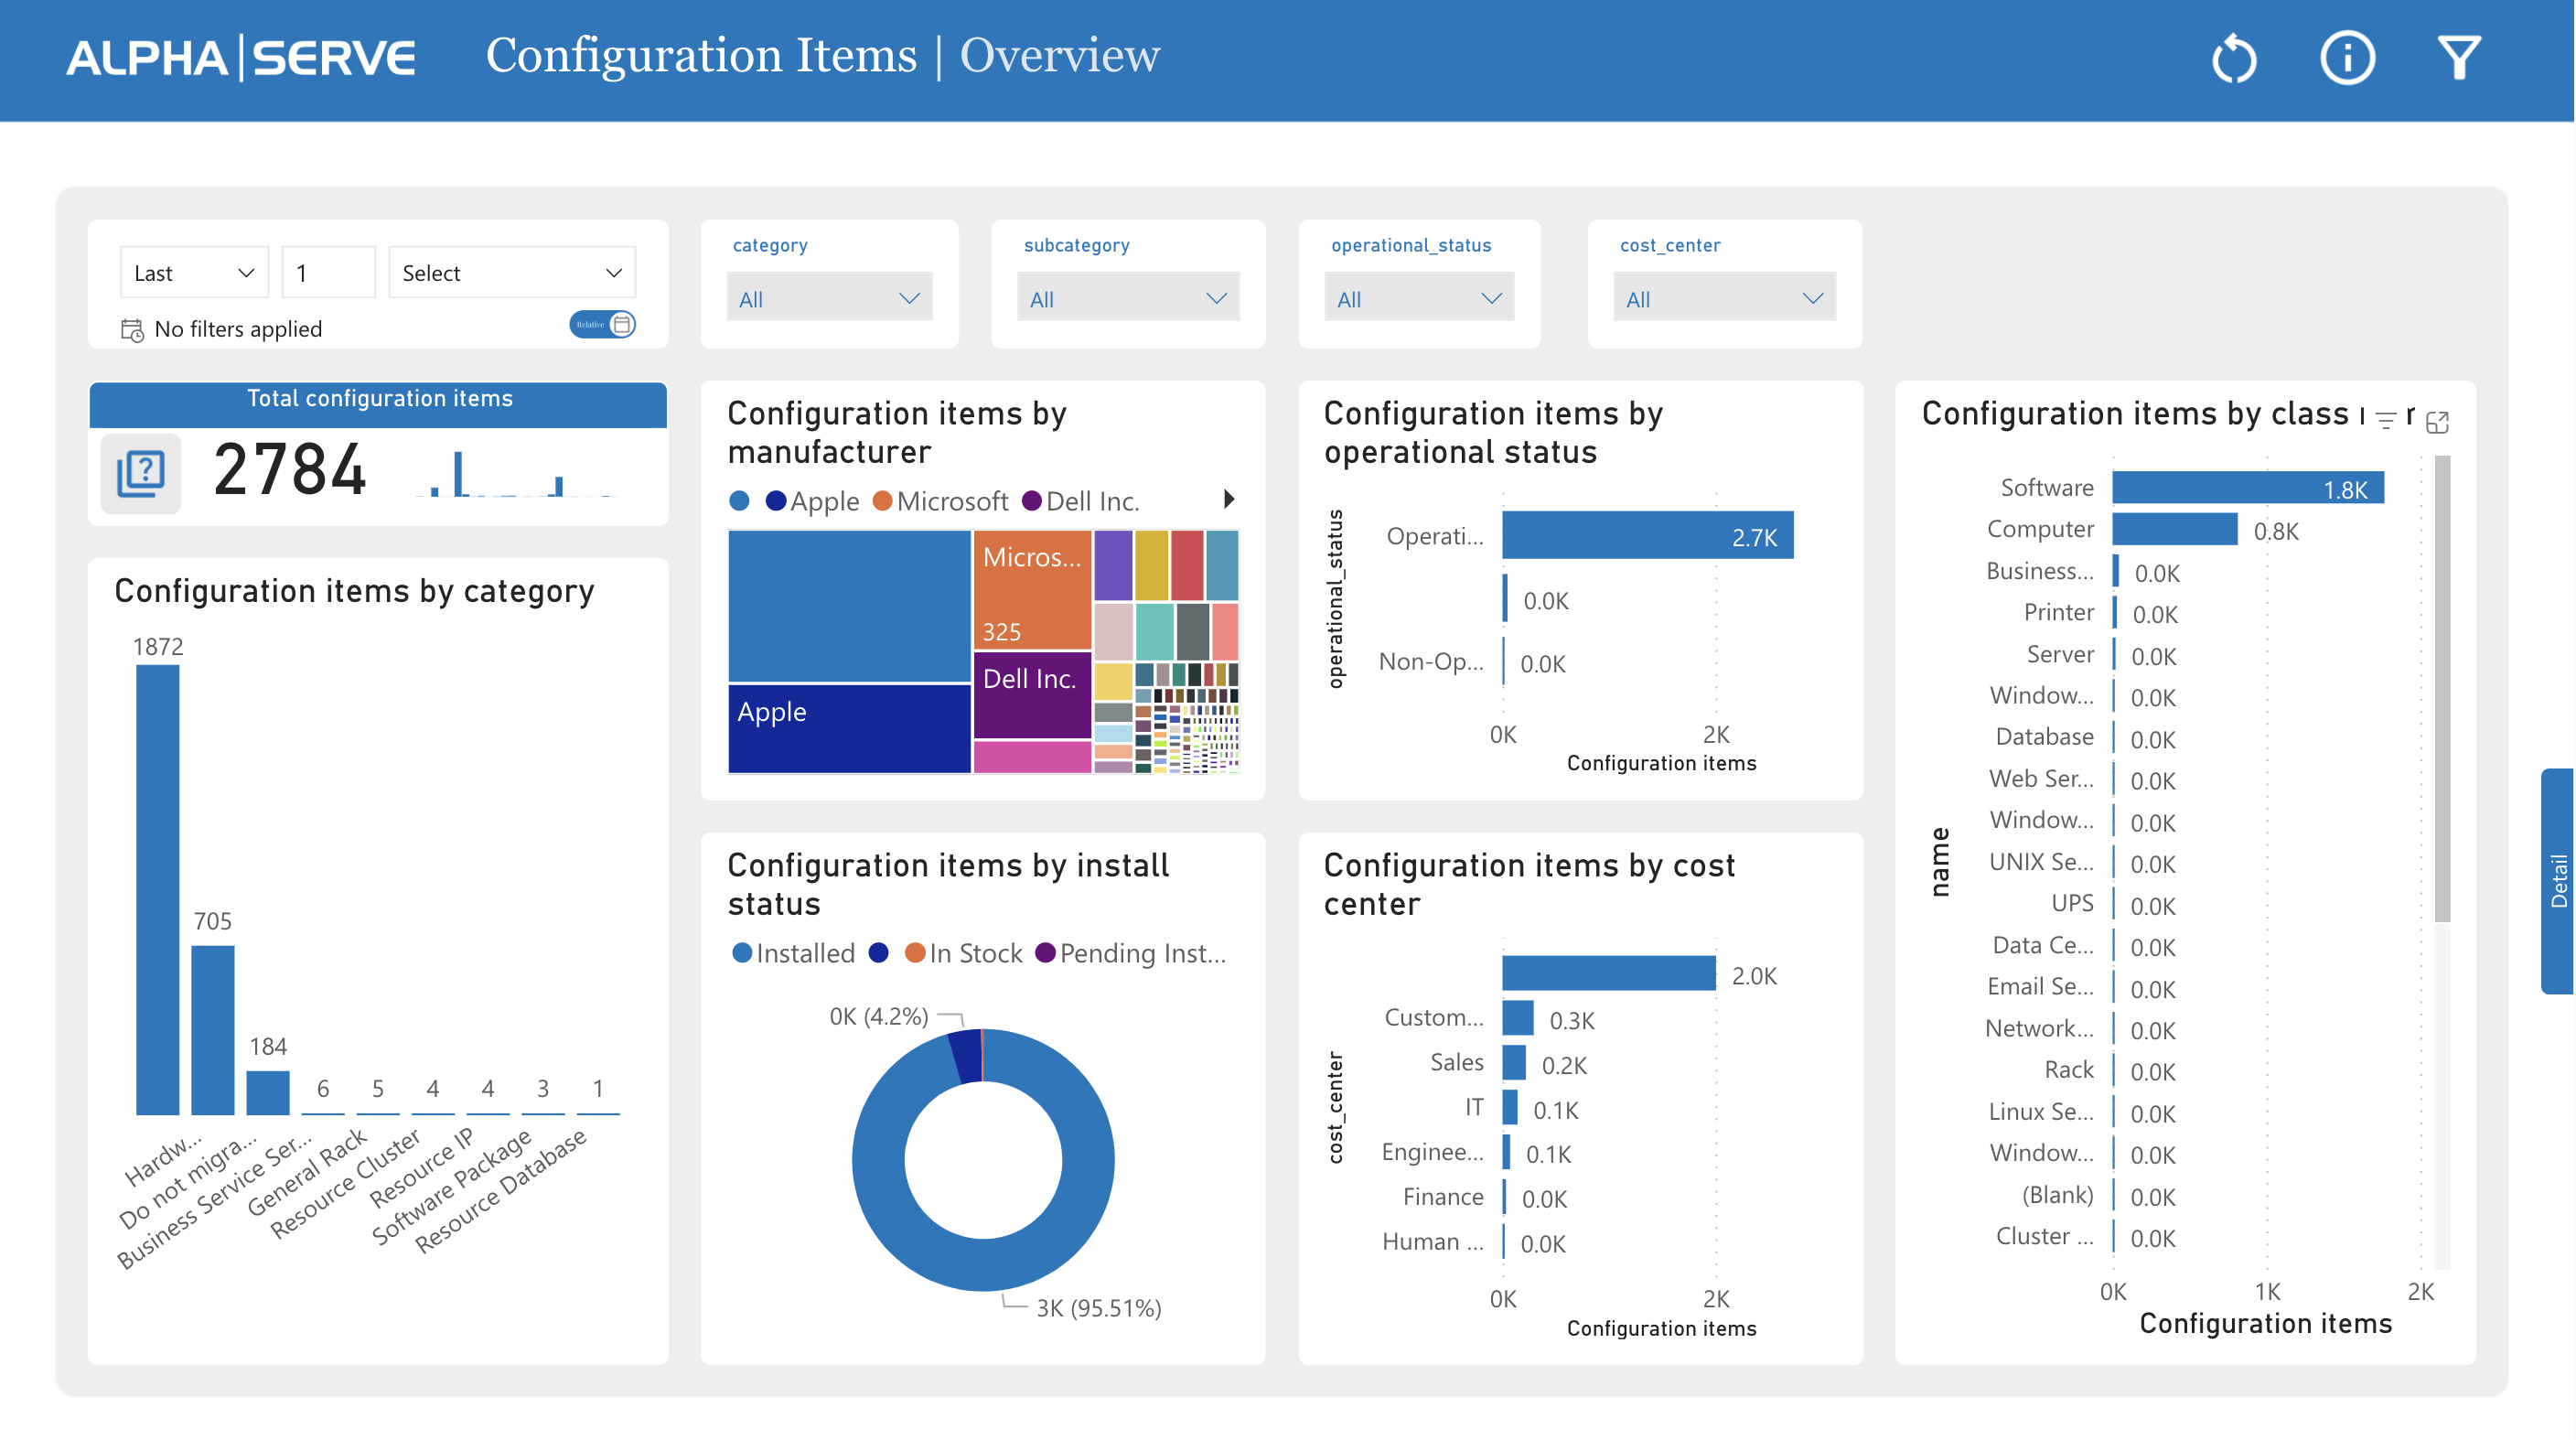
ServiceNow Configuration Items Dashboard
The ServiceNow configuration items report allows users to view and manage configuration items across the organization, providing insights into the IT infrastructure and enabling effective decision-making.
ServiceNow configuration items template from Alpha Serve provides a comprehensive view of the organization's IT infrastructure, helping to ensure that configuration items are properly managed and maintained and that any issues or concerns are promptly addressed.
It includes an overview of configuration items by category, manufacturer, operational status, install status, class, and cost center.