Power BI dashboard templates supported with pre-configured data sources are now available in this latest version. We are happy to offer you the new and exciting Power BI Jira reporting experience!
Build your first Power BI dashboard in a day with Jira Power BI dashboard templates in Power BI Connector for Jira from Alpha Serve!
| Table of Contents | ||||
|---|---|---|---|---|
|
How to Use Power BI Templates?
Go to the Templates tab.
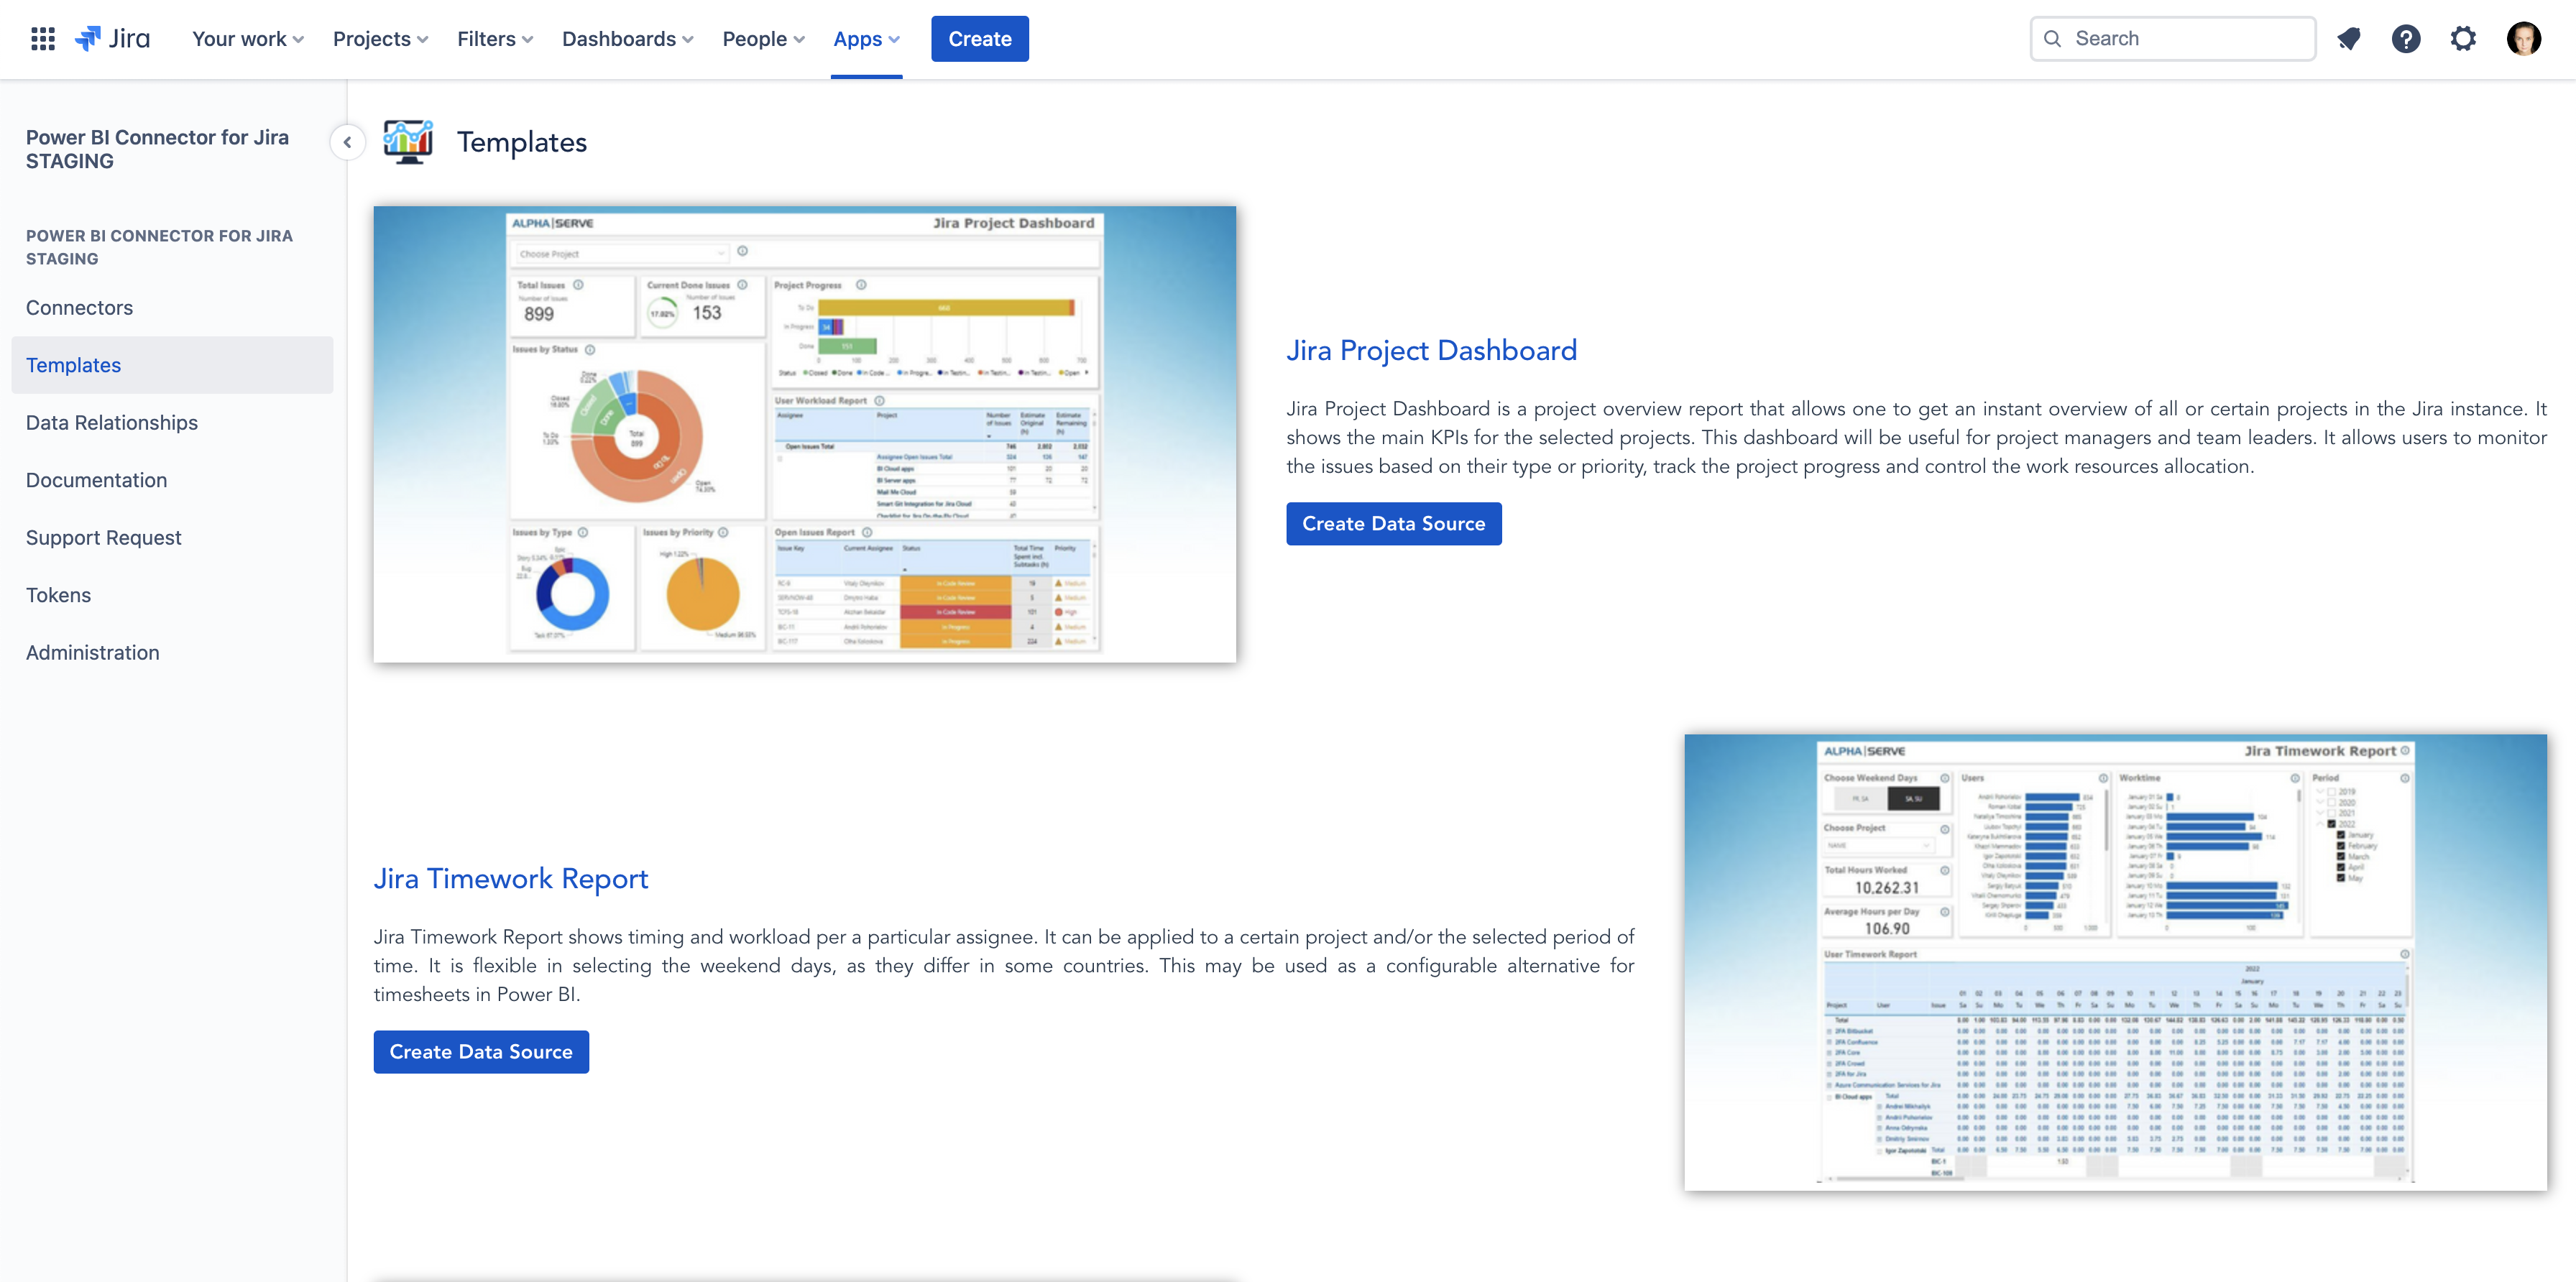
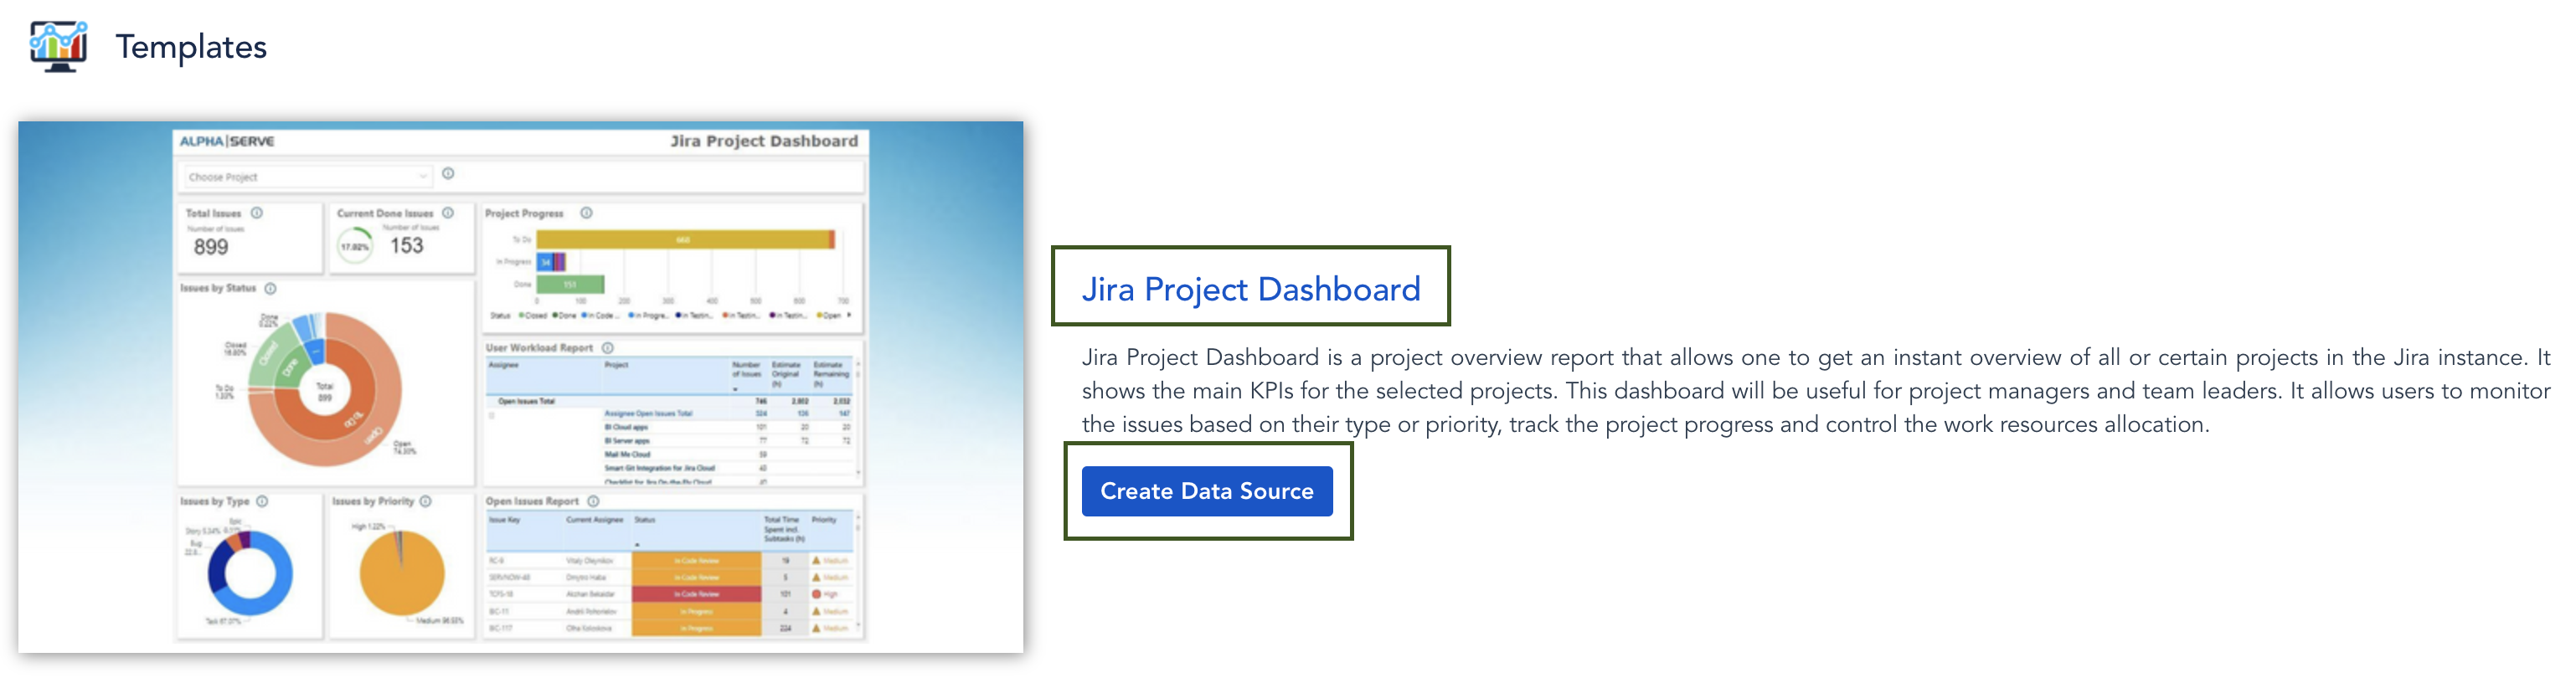
2. Select the template you would like to use and click either on its name or the Create Data Source button.
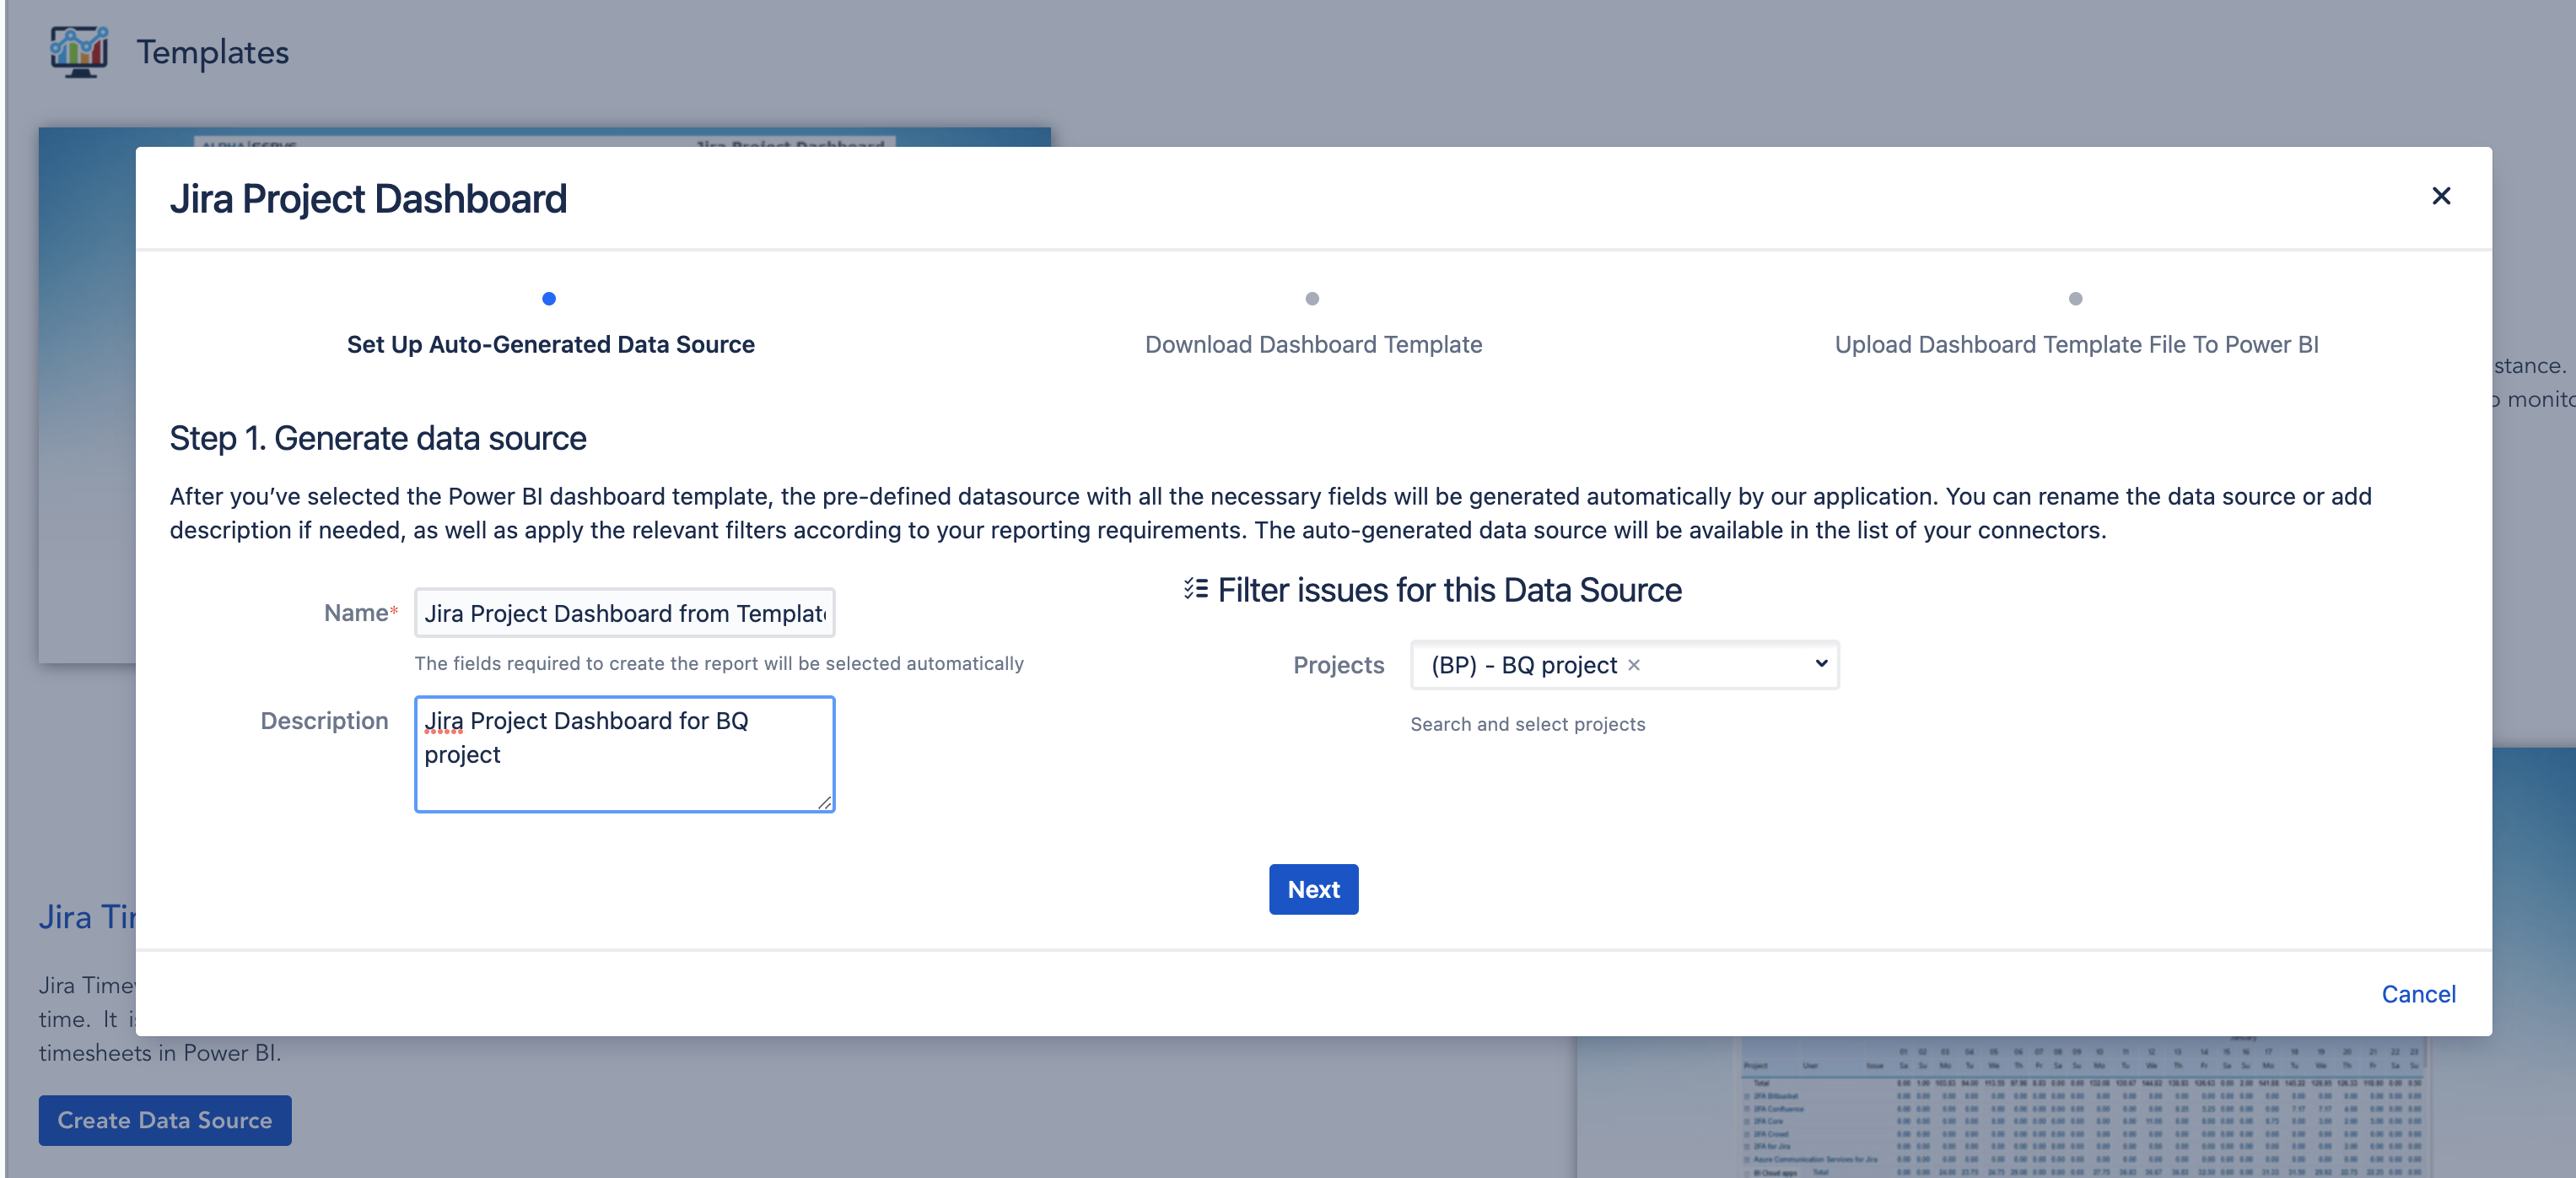
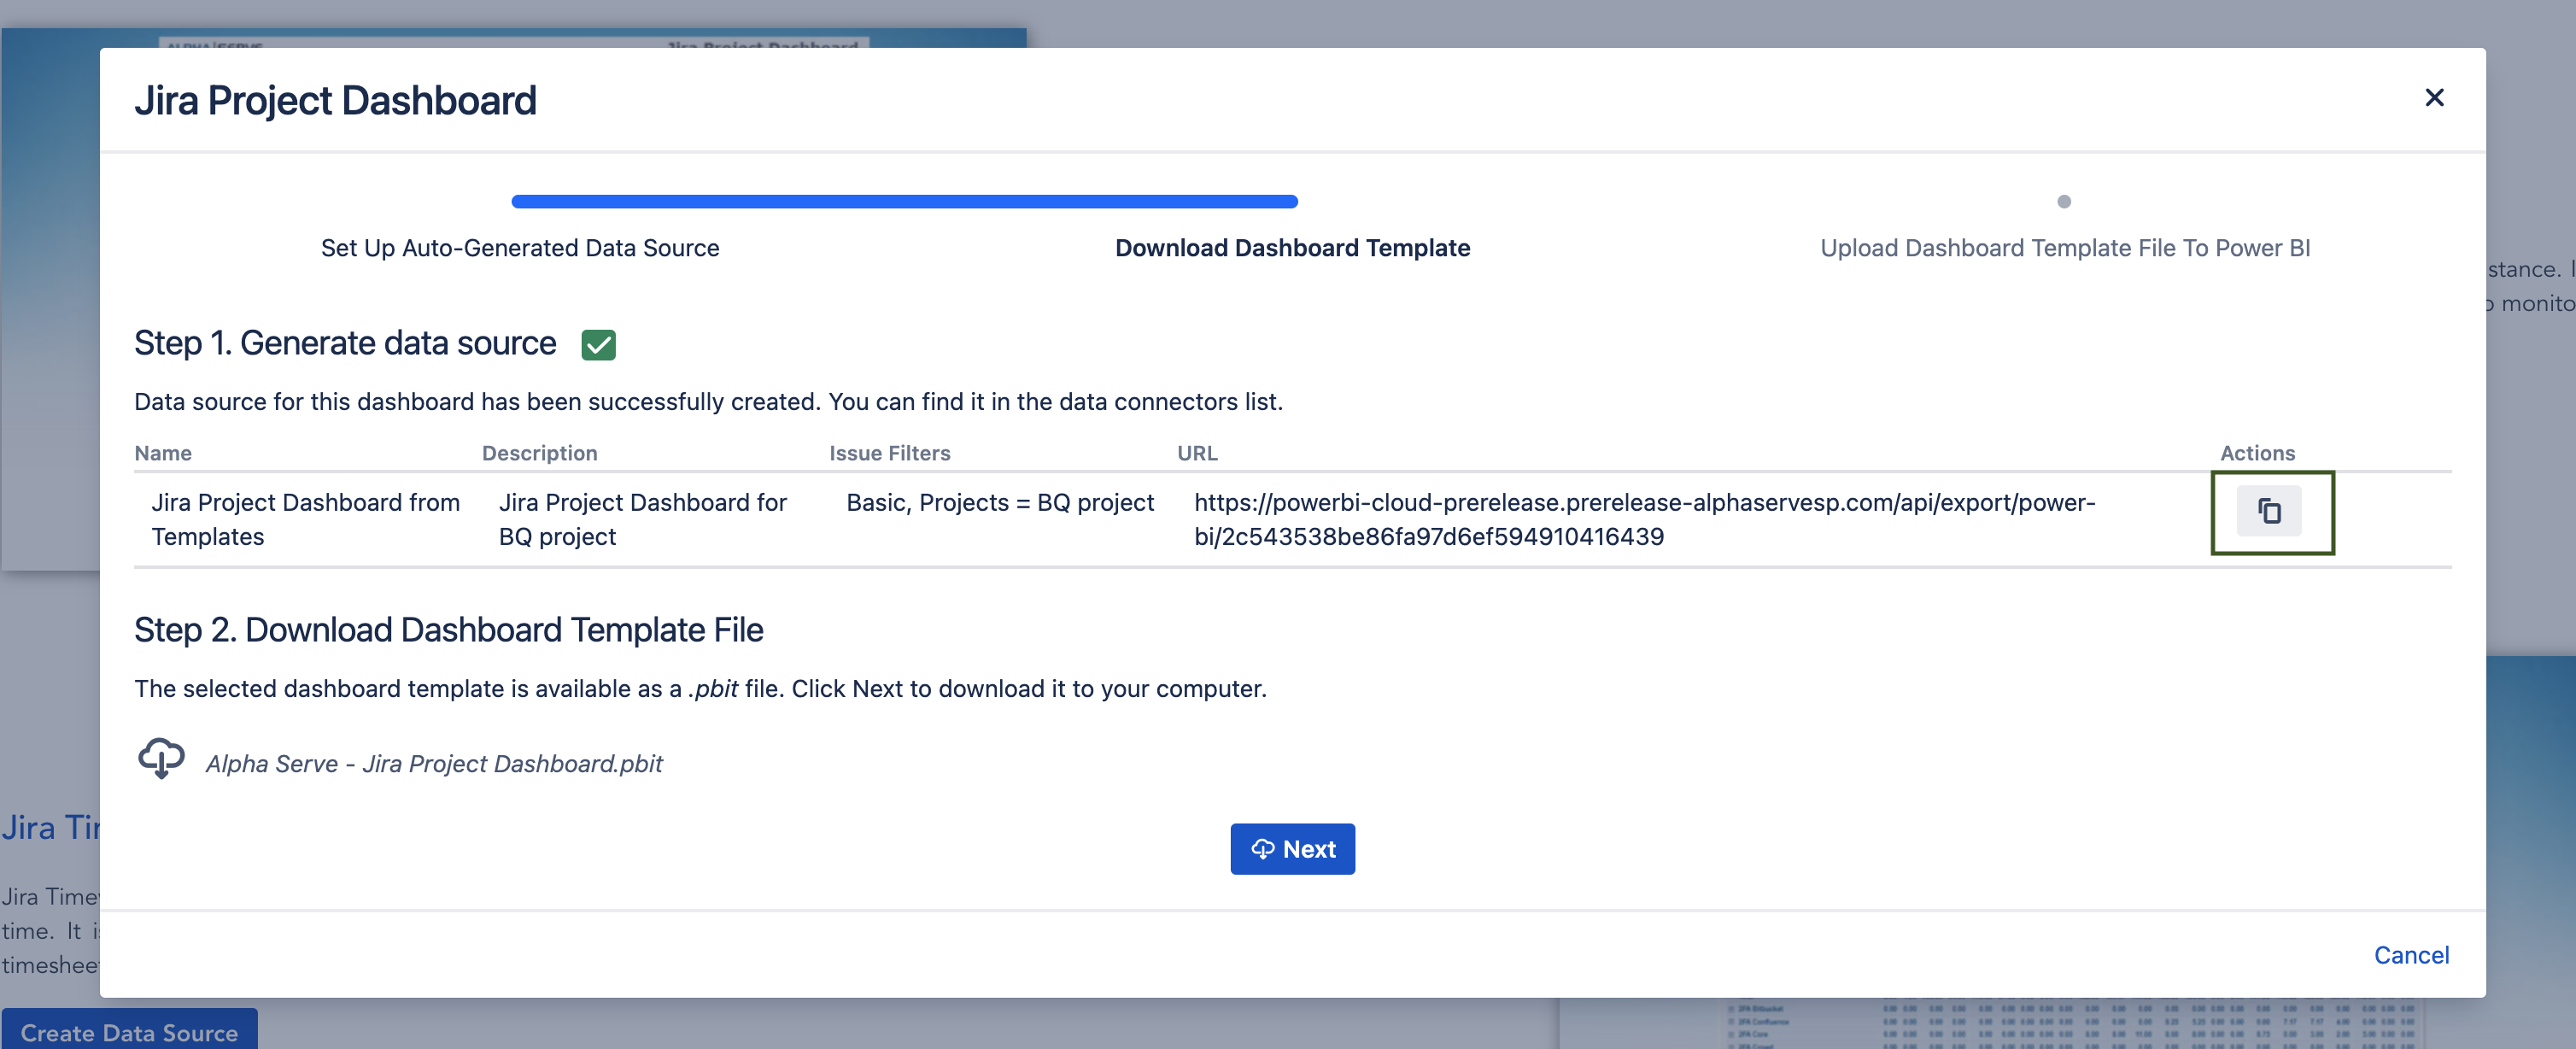
3. Set up the auto-generated data source. You can edit the data source name, add a description and apply a project filter. Click Next.
4. Copy the generated data source link and click the Next button to download the .pbit file.
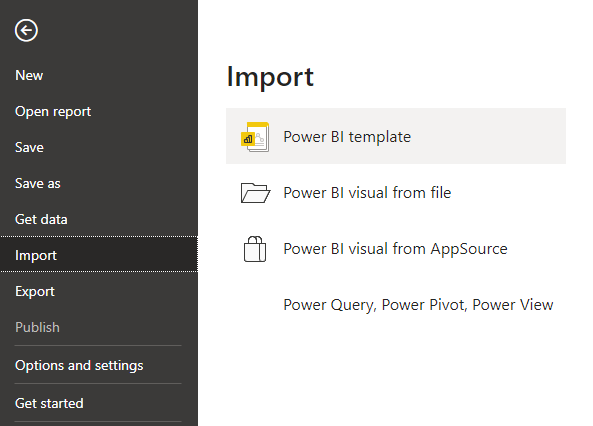
5. Open Power BI Desktop. Go to File > Import > Power BI template and select the .pbit file you’ve downloaded in the previous step.
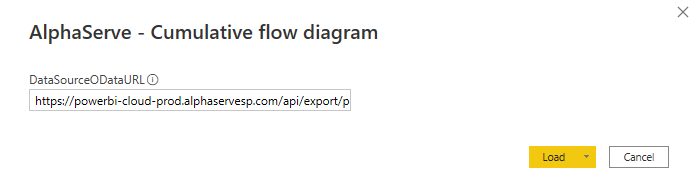
6. Insert a copied data source URL into the corresponding field.
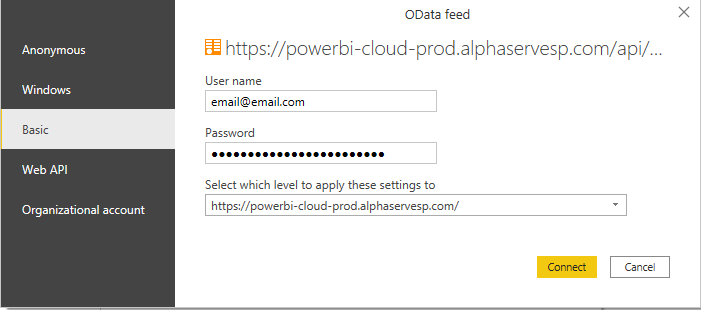
7. Select Basic Authentication and input your credentials. This step is described in more detail in our User Guide: https://aserve.atlassian.net/wiki/spaces/PBCFJC/pages/1088454657/User+Guide#Export-data-into-Microsoft-Power-BI-Desktop.
Jira Dashboard Templates Description
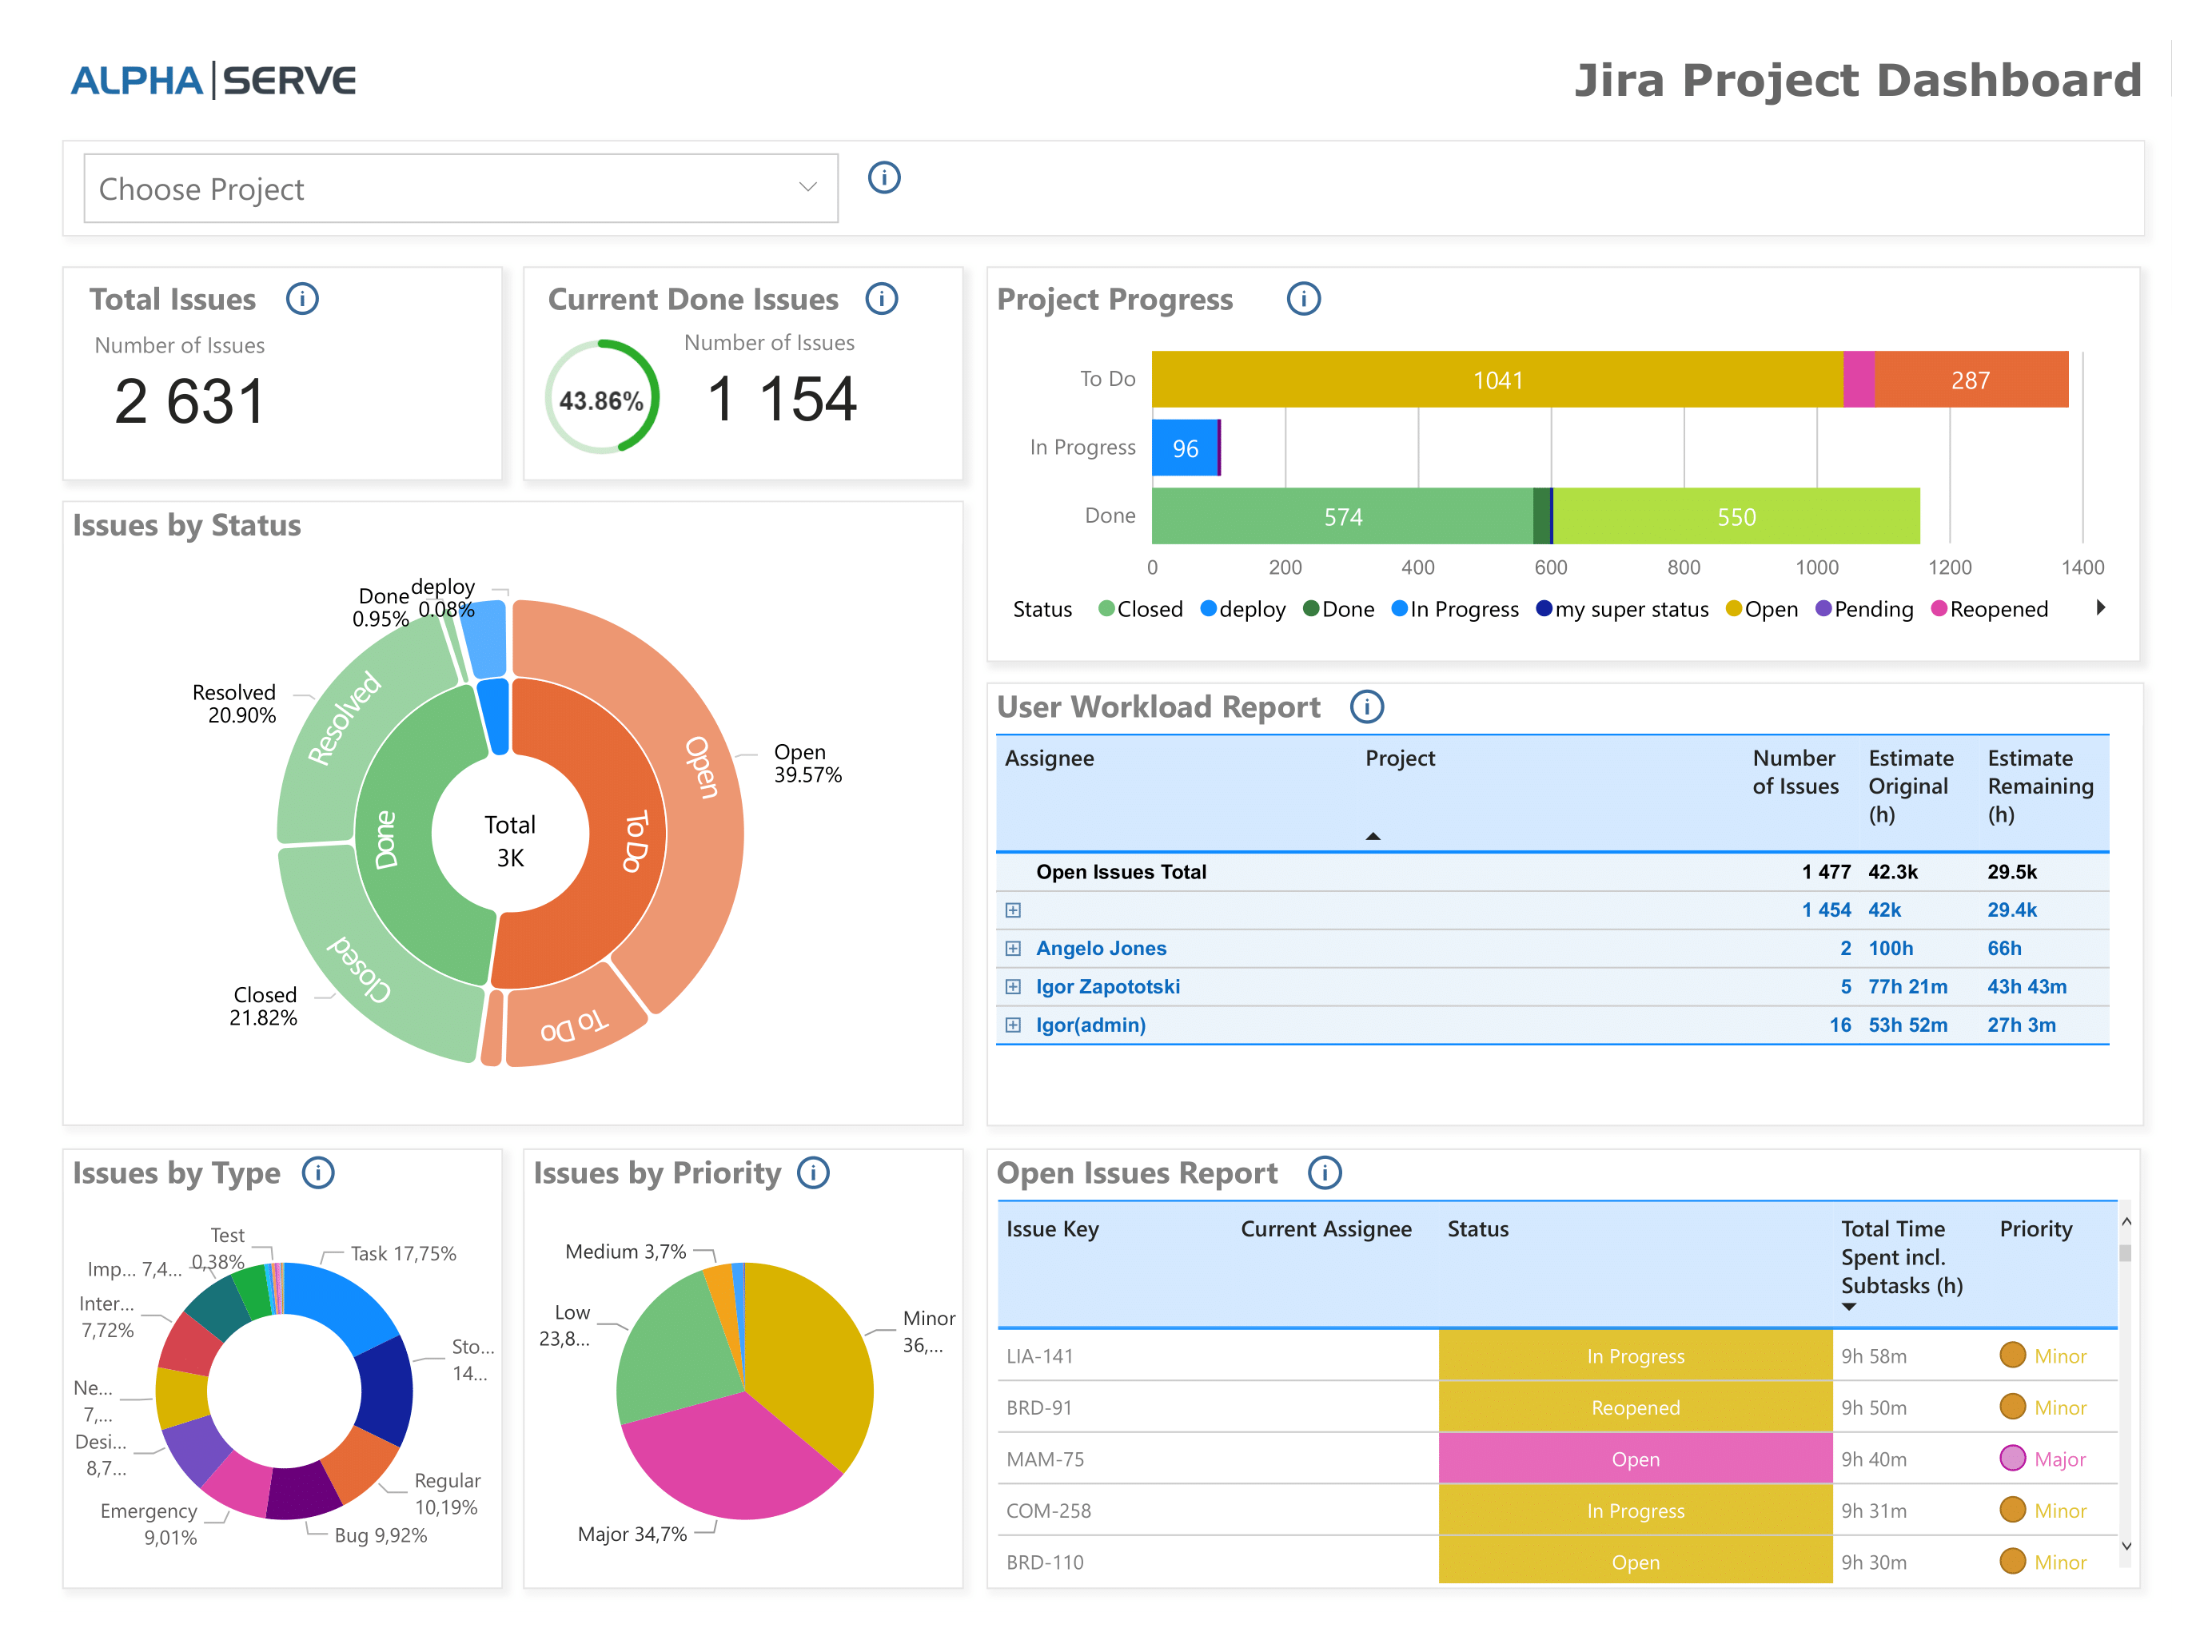
Jira Project Dashboard
Jira Project Dashboard is a project overview report that allows one to get an instant overview of all or certain projects in the Jira instance. It shows the main KPIs for the selected projects.
This dashboard will be useful for project managers and team leaders. It allows users to monitor the issues based on their type or priority, track the project progress and control the work resources allocation.
Jira Project Dashboard template can also be used to build Jira dashboard for multiple projects that is challenging in the default Jira reporting. With Power BI Connector for Jira it is possible to build any multiple projects dashboard that you need in Power BI.
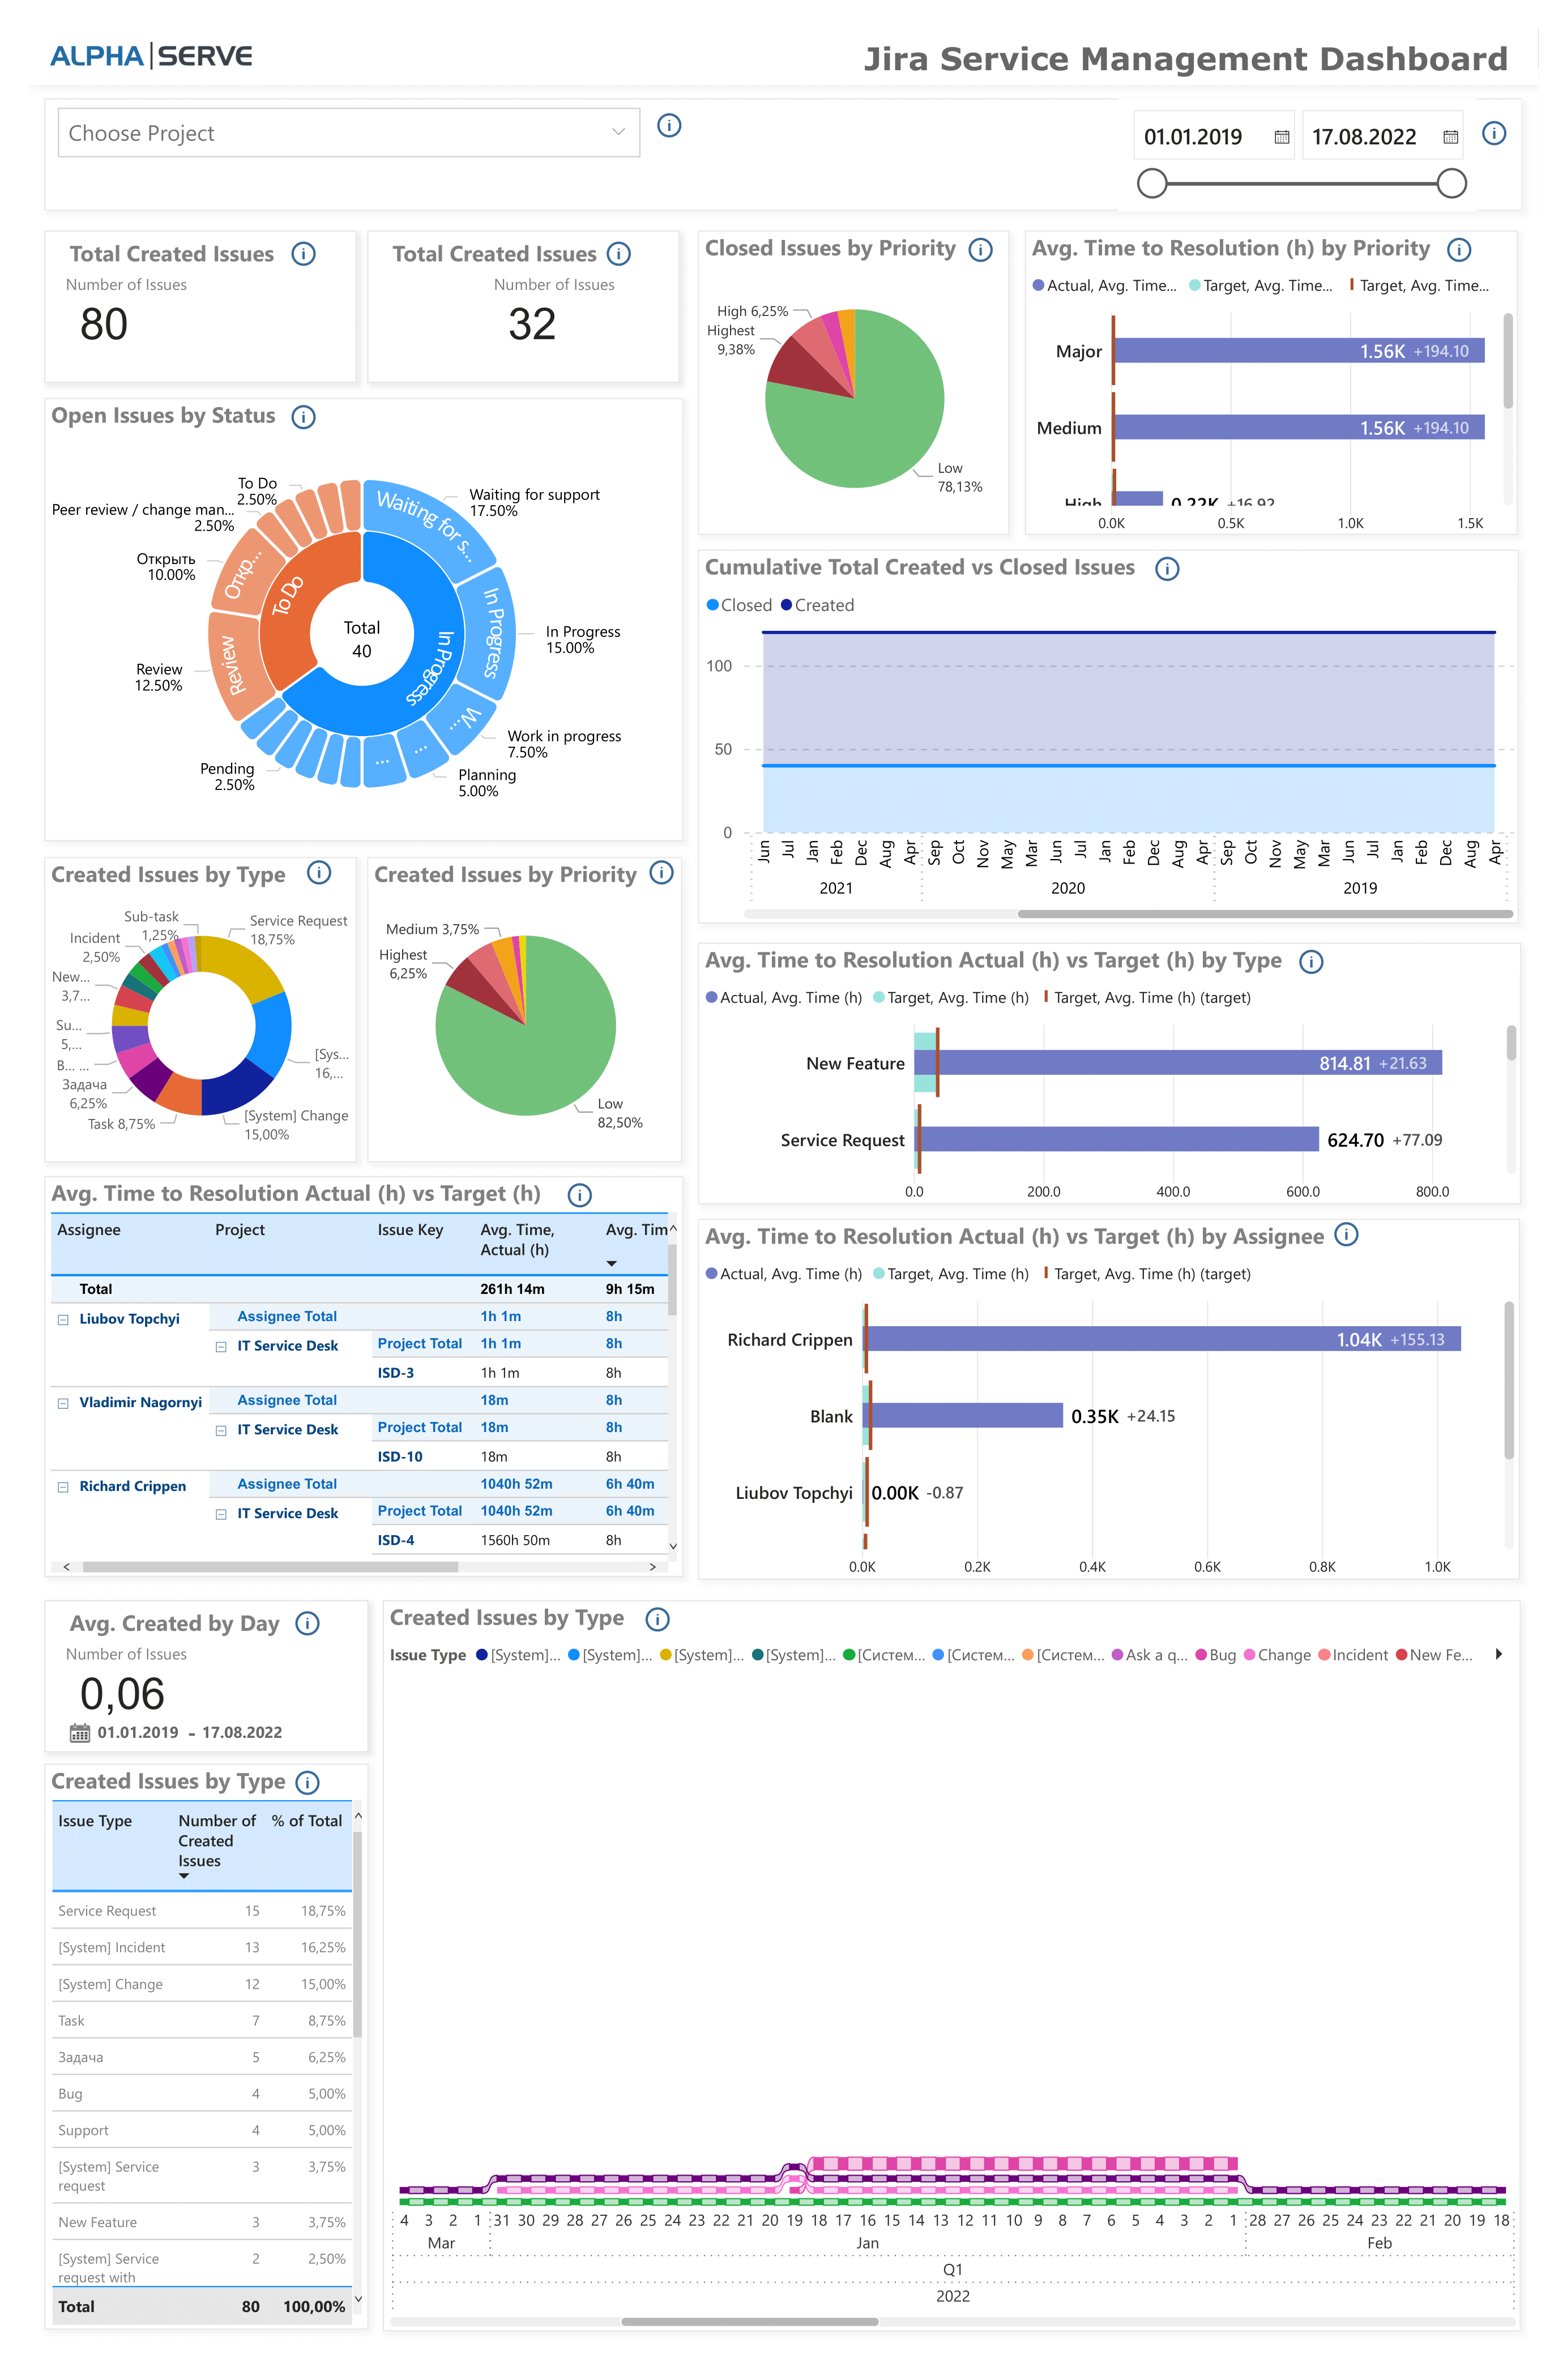
Jira Service Management Dashboard
Jira Service Management Dashboard shows the major service level indicators for the definite Jira ITSM projects. It will be useful as a daily monitoring tool for team leaders of the support or customer accounting teams, as it visualizes the total number of open and closed tickets, their share division, and their division by types or priority.
The SLA indicators are also included in this dashboard, such as Average Time to Resolution (Estimated and Actual), including by Assignee, or types of issues created by type.

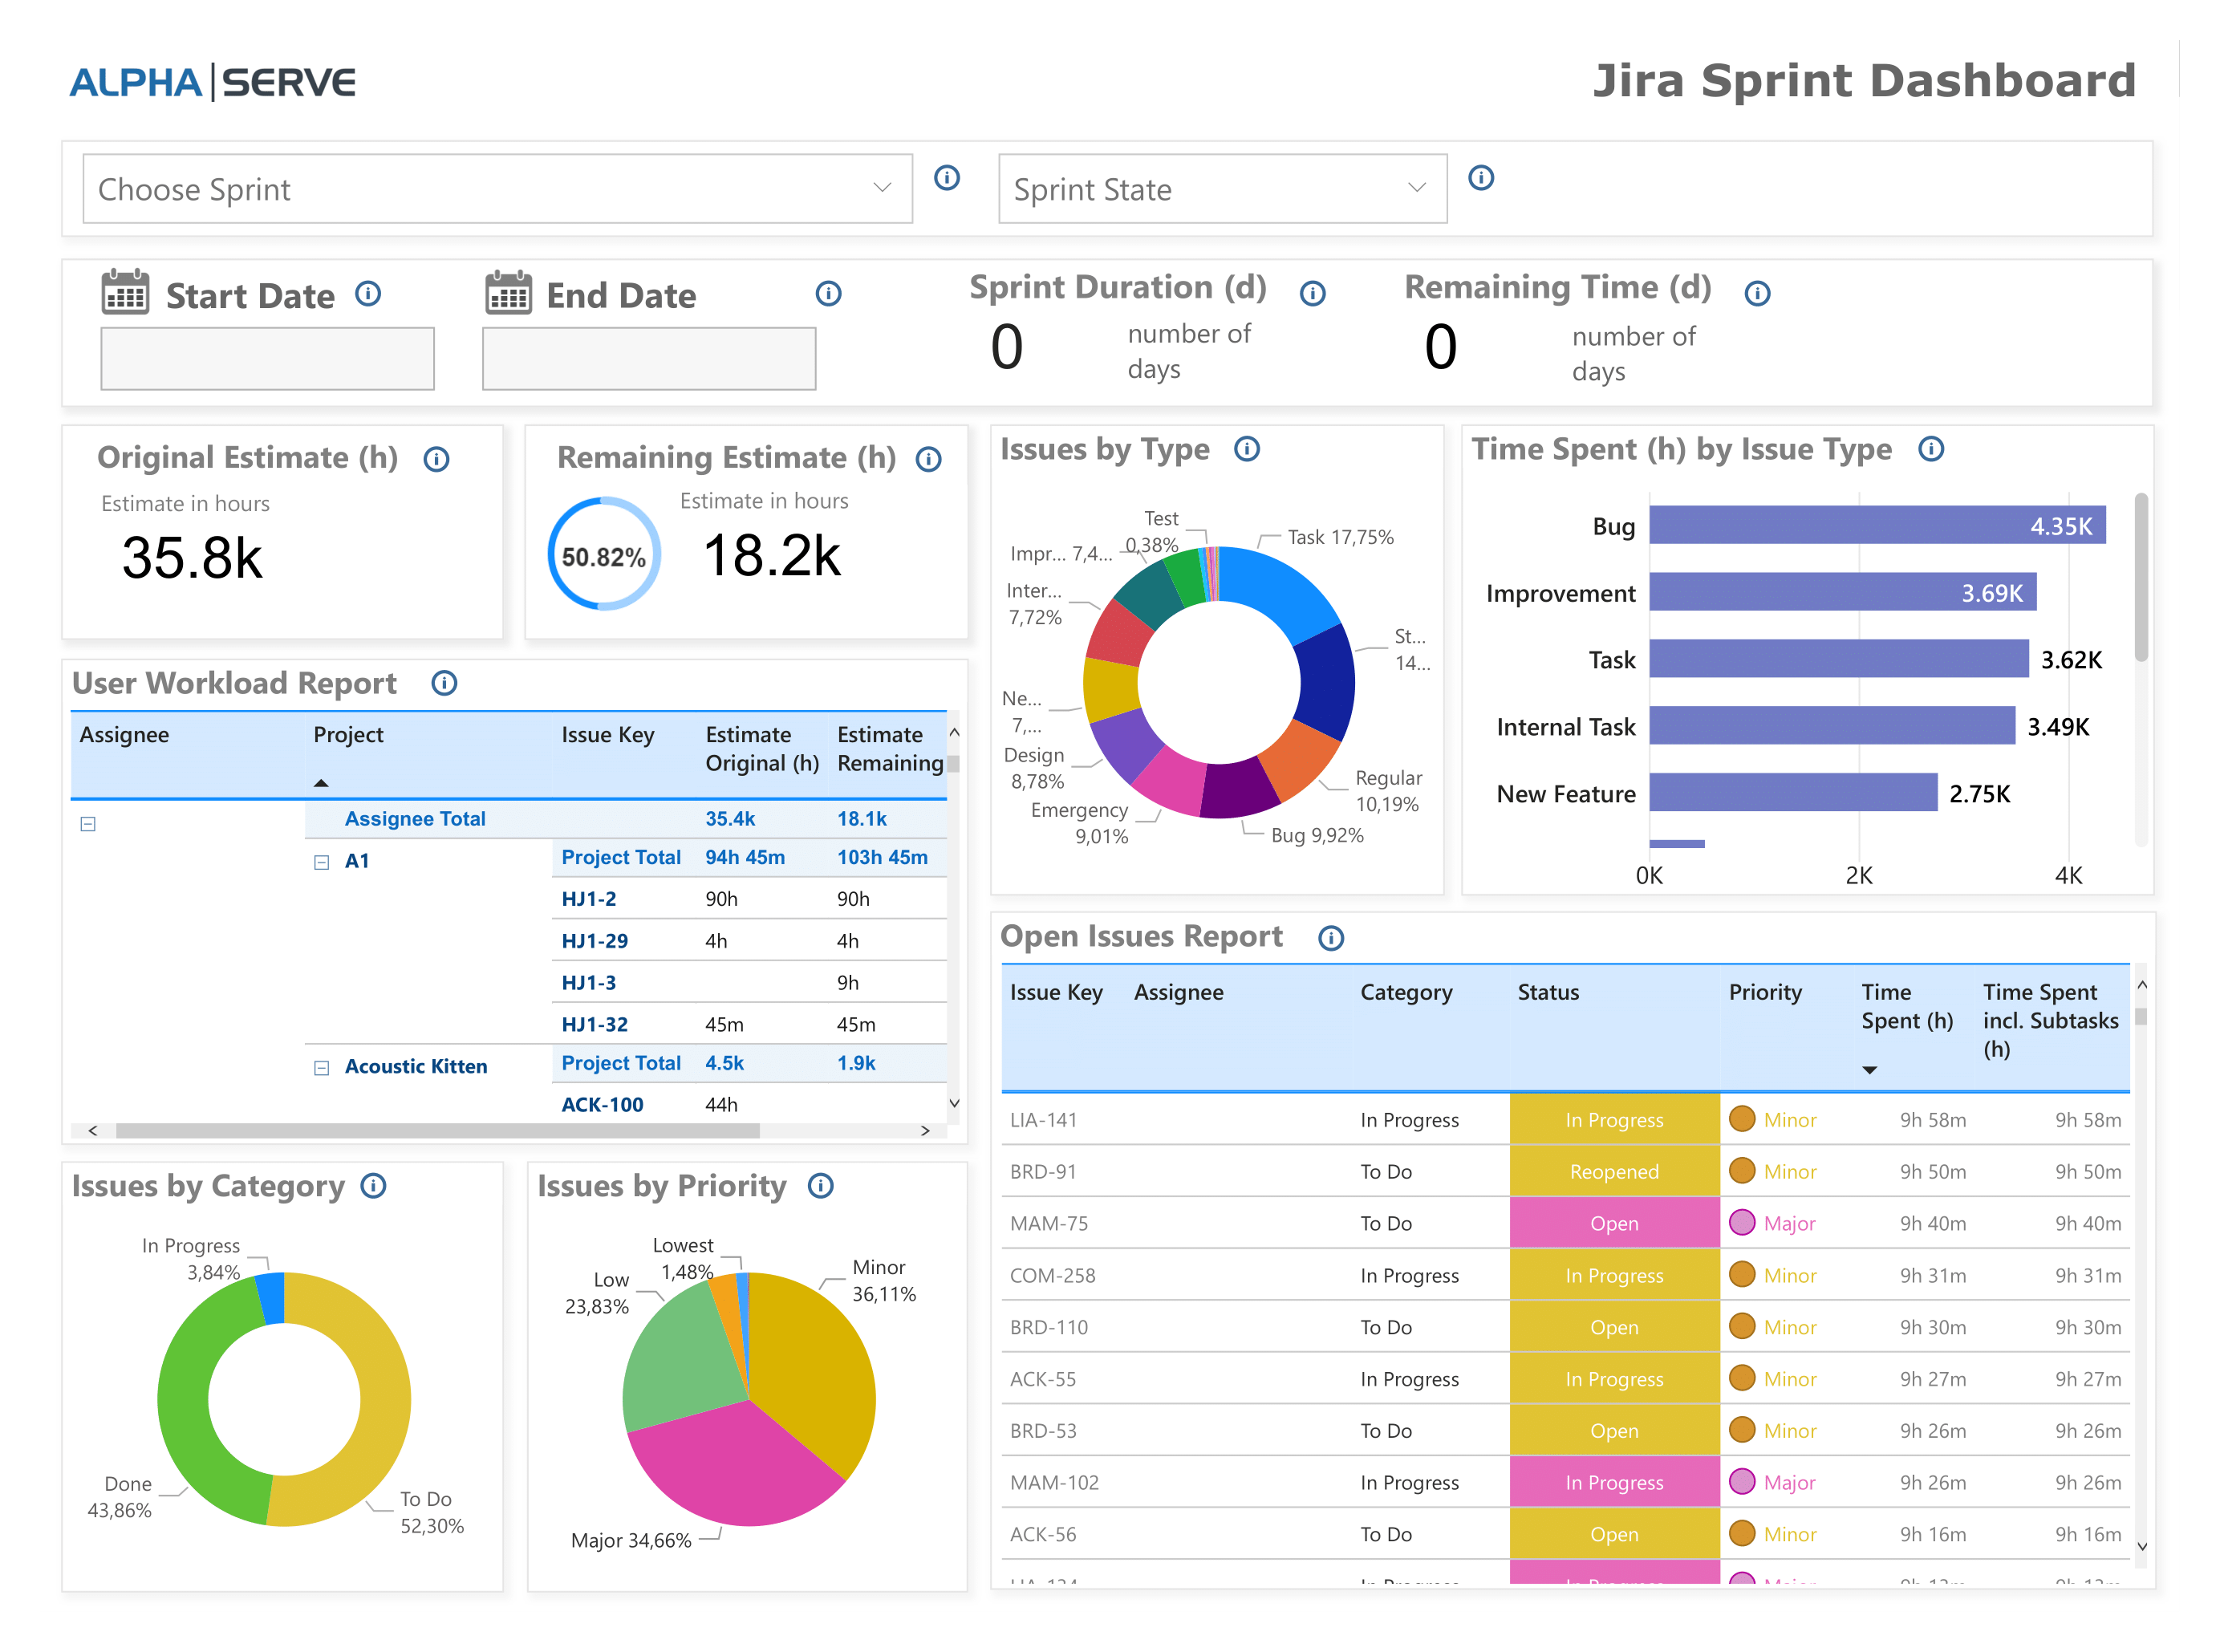
Jira Sprint Dashboard
Jira Sprint Dashboard shows the main metrics used to monitor the sprint progress (for the current sprint) or sprint results (for the completed sprints).
It is useful for team leads and project managers to monitor sprint progress or analyze the finished sprint in retrospective.
Jira Sprint Time Report
Jira Sprint Time Report is actually time tracking report Jira sprint. It shows timing progress on the sprint and the comparison of the original estimates and actual performance in a certain sprint. It allows users to see the time efforts on each issue and the time load per assignee.
.png?version=1&modificationDate=1662117597252&cacheVersion=1&api=v2&width=448)
.png?version=1&modificationDate=1662117597252&cacheVersion=1&api=v2&width=442)
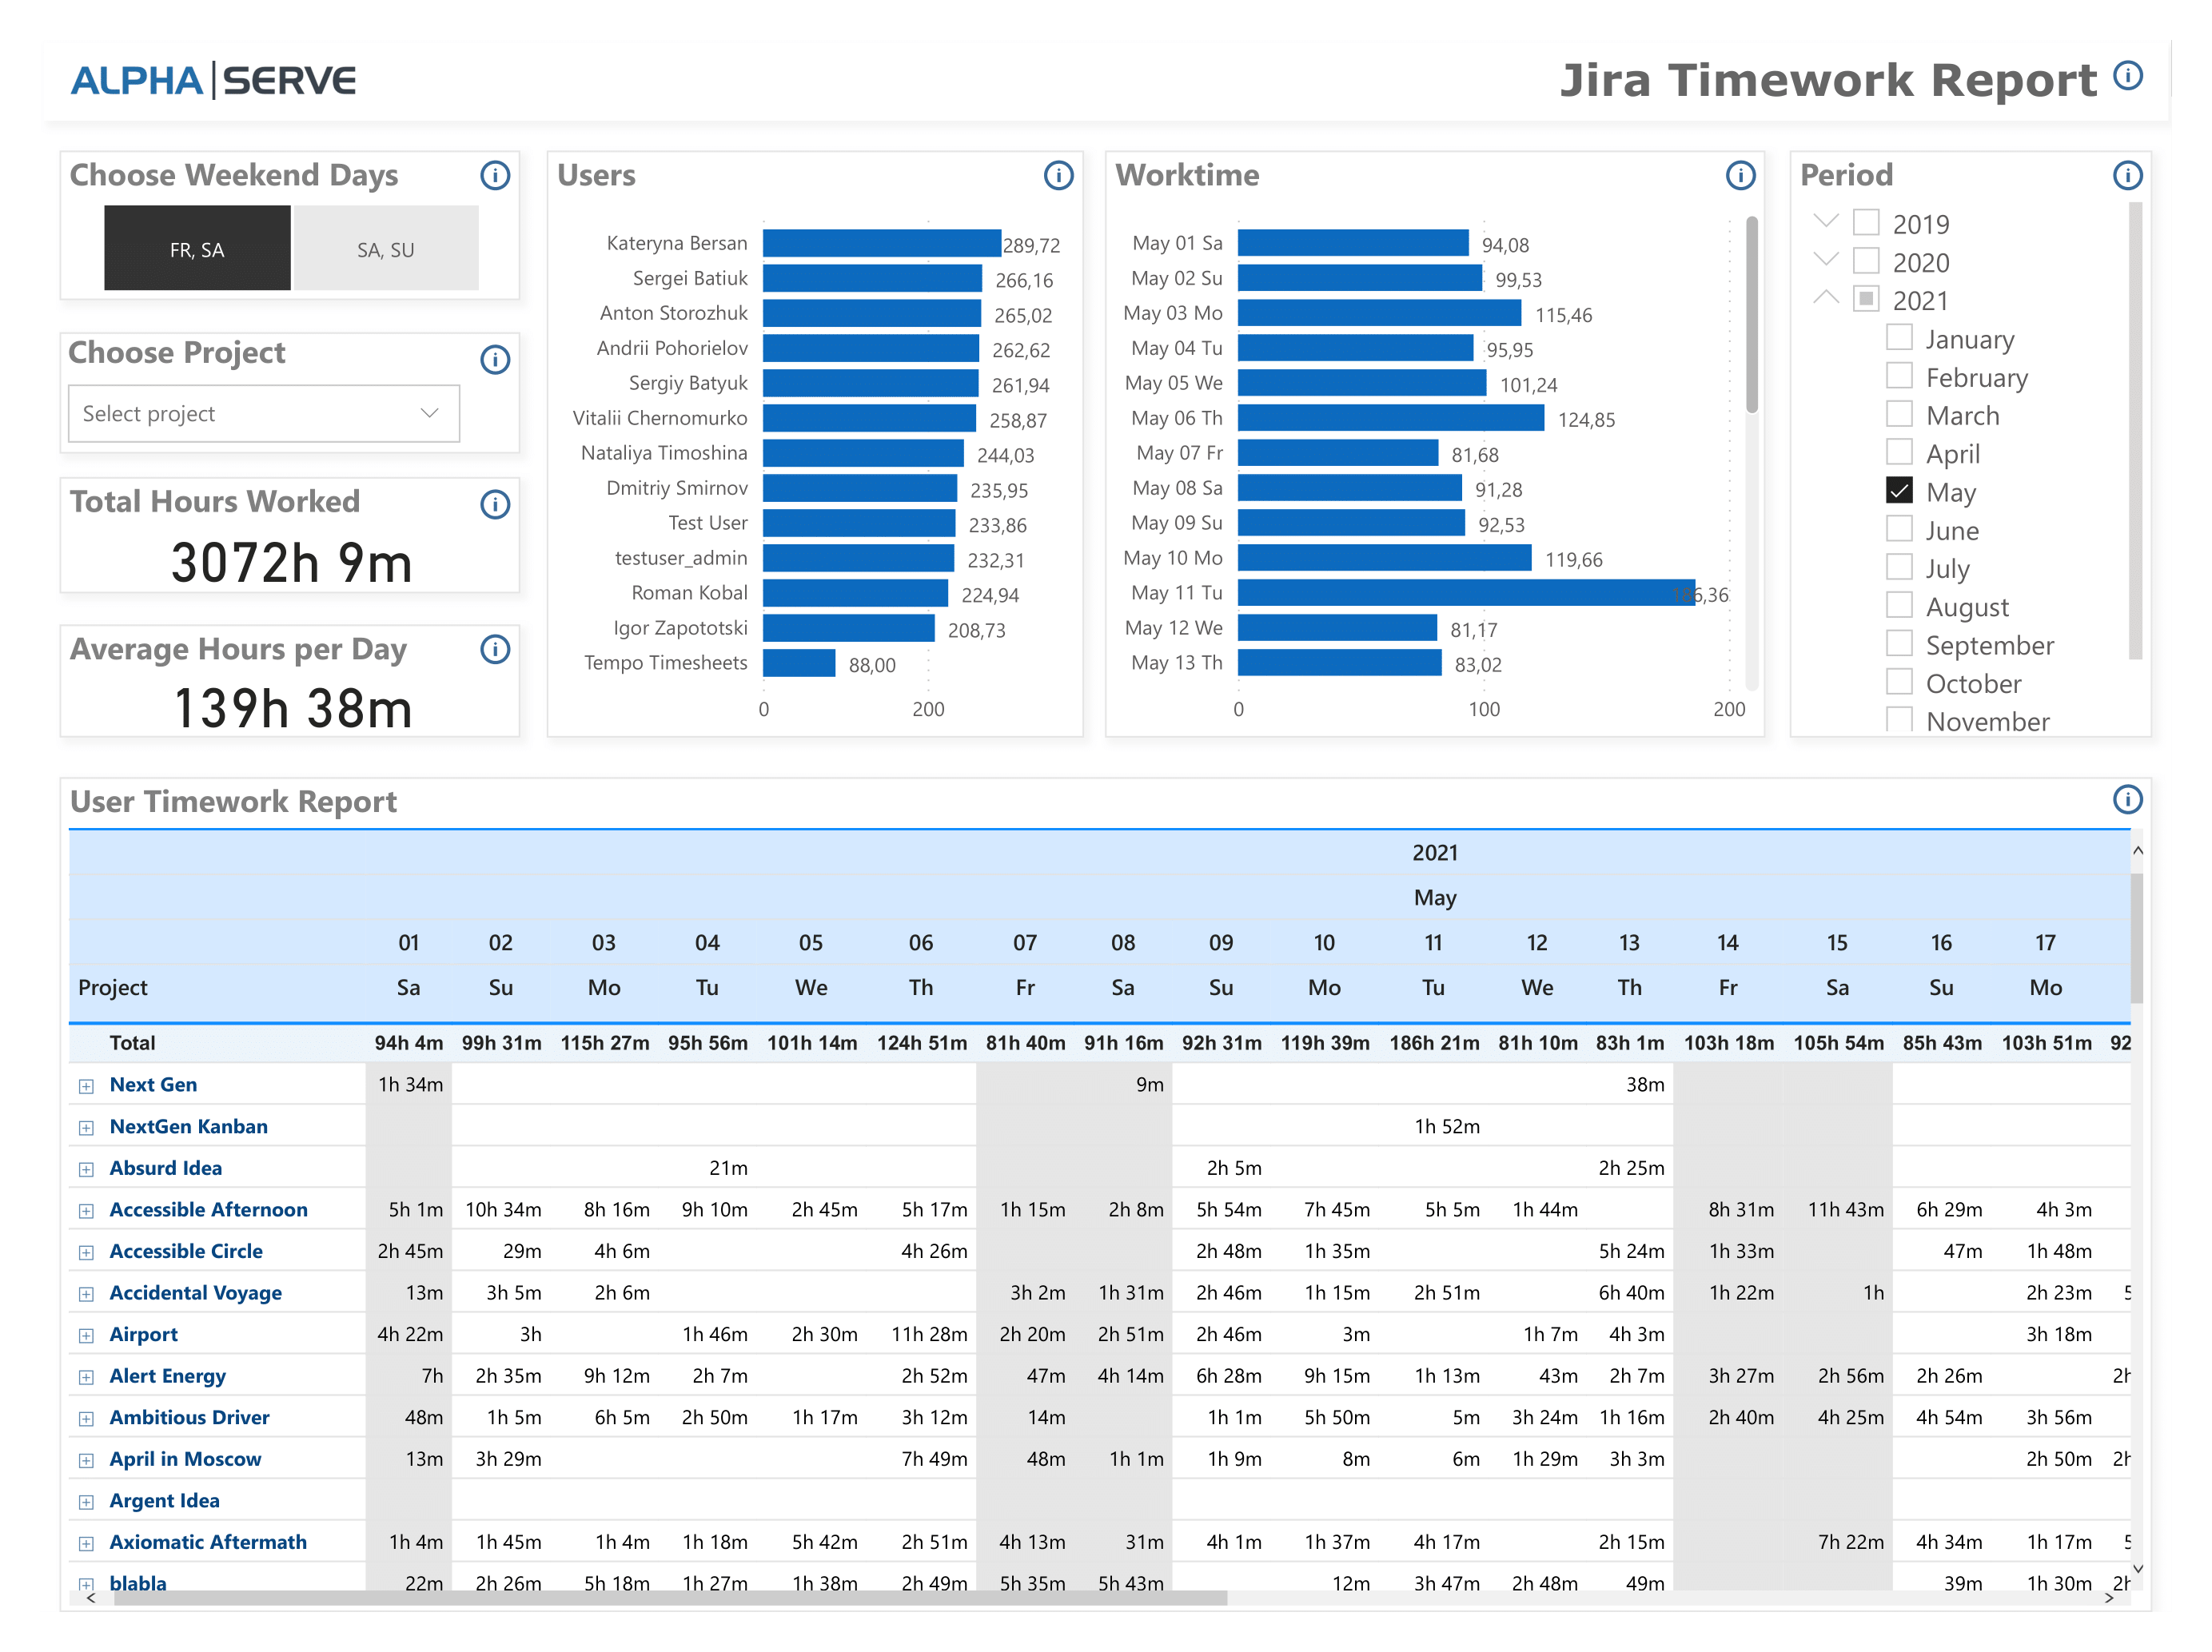
Jira Work Log Report / Jira Time Work Report
Jira Time Work Report shows timing and workload per a particular assignee. It is a Jira wok work log repot report that can be applied to a certain project and/or the selected period of time. It is flexible in selecting the weekend days, as they differ in some countries. This may be used as a configurable alternative for timesheets in Power BI.
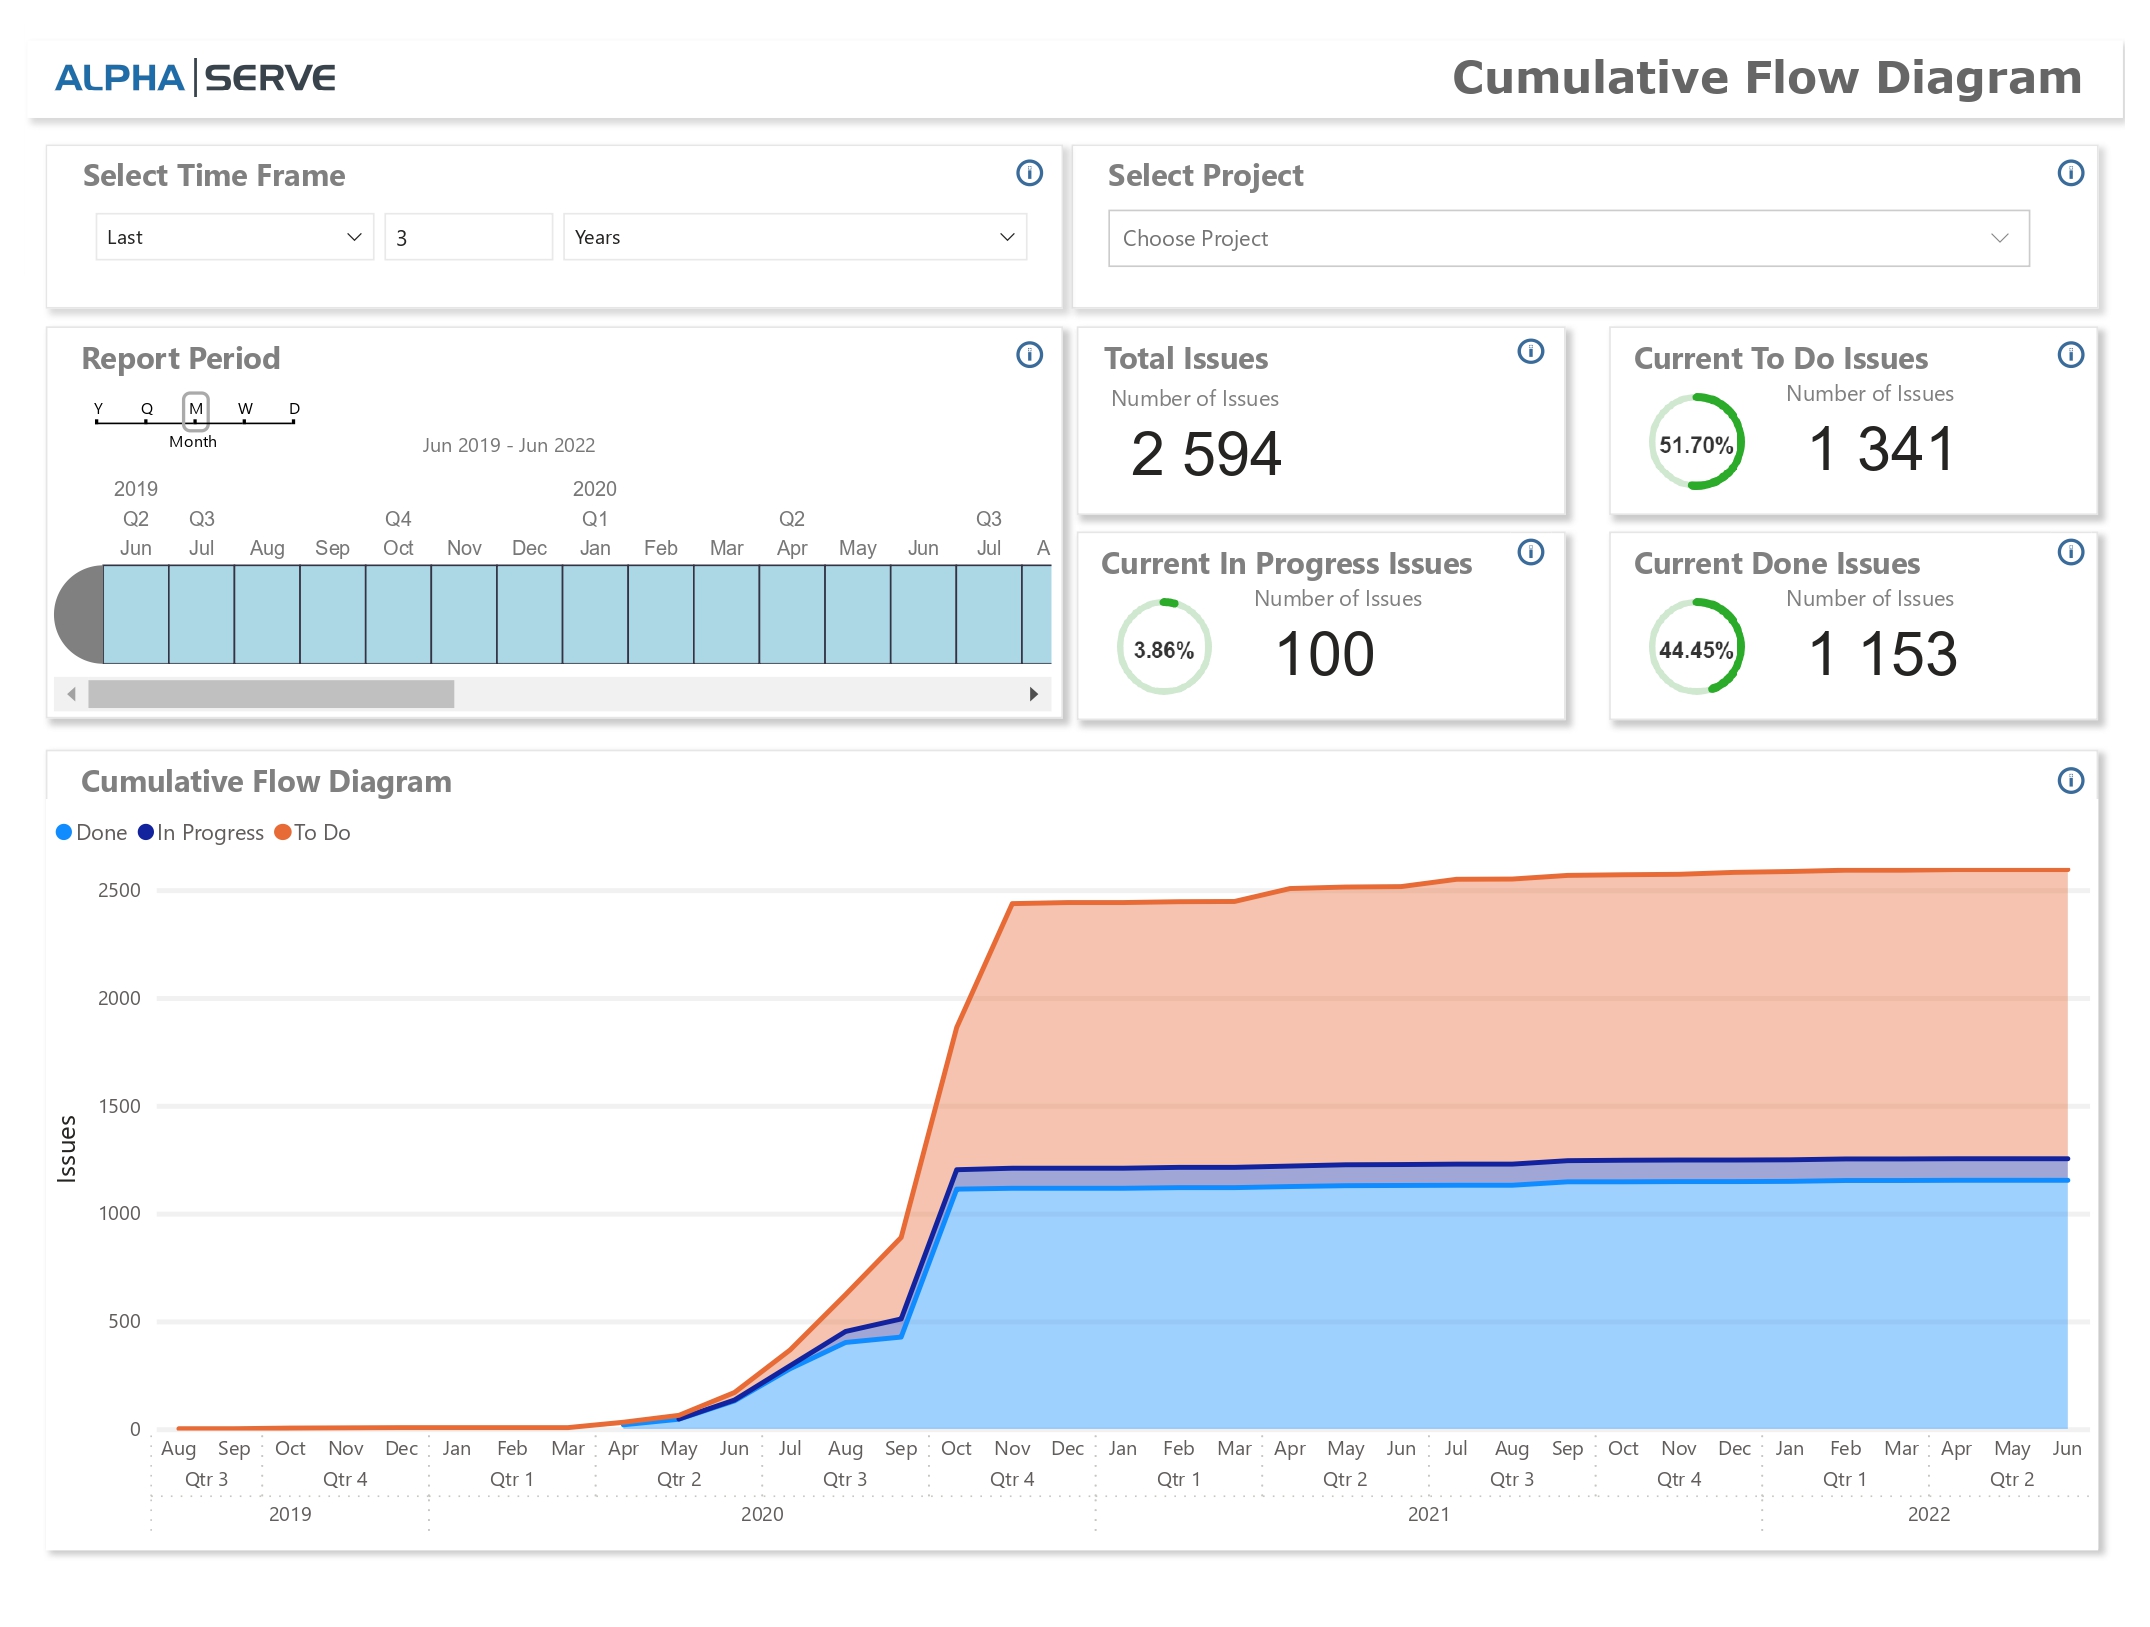
Jira Cumulative Flow Diagram
The Cumulative flow diagram shows the various statuses of Jira project's issues over time. It's a visual indication of how many issues are passing through each status, thus, through the column of your project board. This helps users see which columns accumulate more issues than others, and identify bottlenecks in your team's workflow - and take actions accordingly and on time.
Project Helicopter View / Jira Project Overview Report
Project Helicopter View is a big-picture view report on a certain project. It is built based on Jira + Projectrak app data. It allows users to see the overall projects that are currently open in the company, which types they are and how many projects and managed by one team lead.
.jpg?version=1&modificationDate=1662117441566&cacheVersion=1&api=v2&width=442)
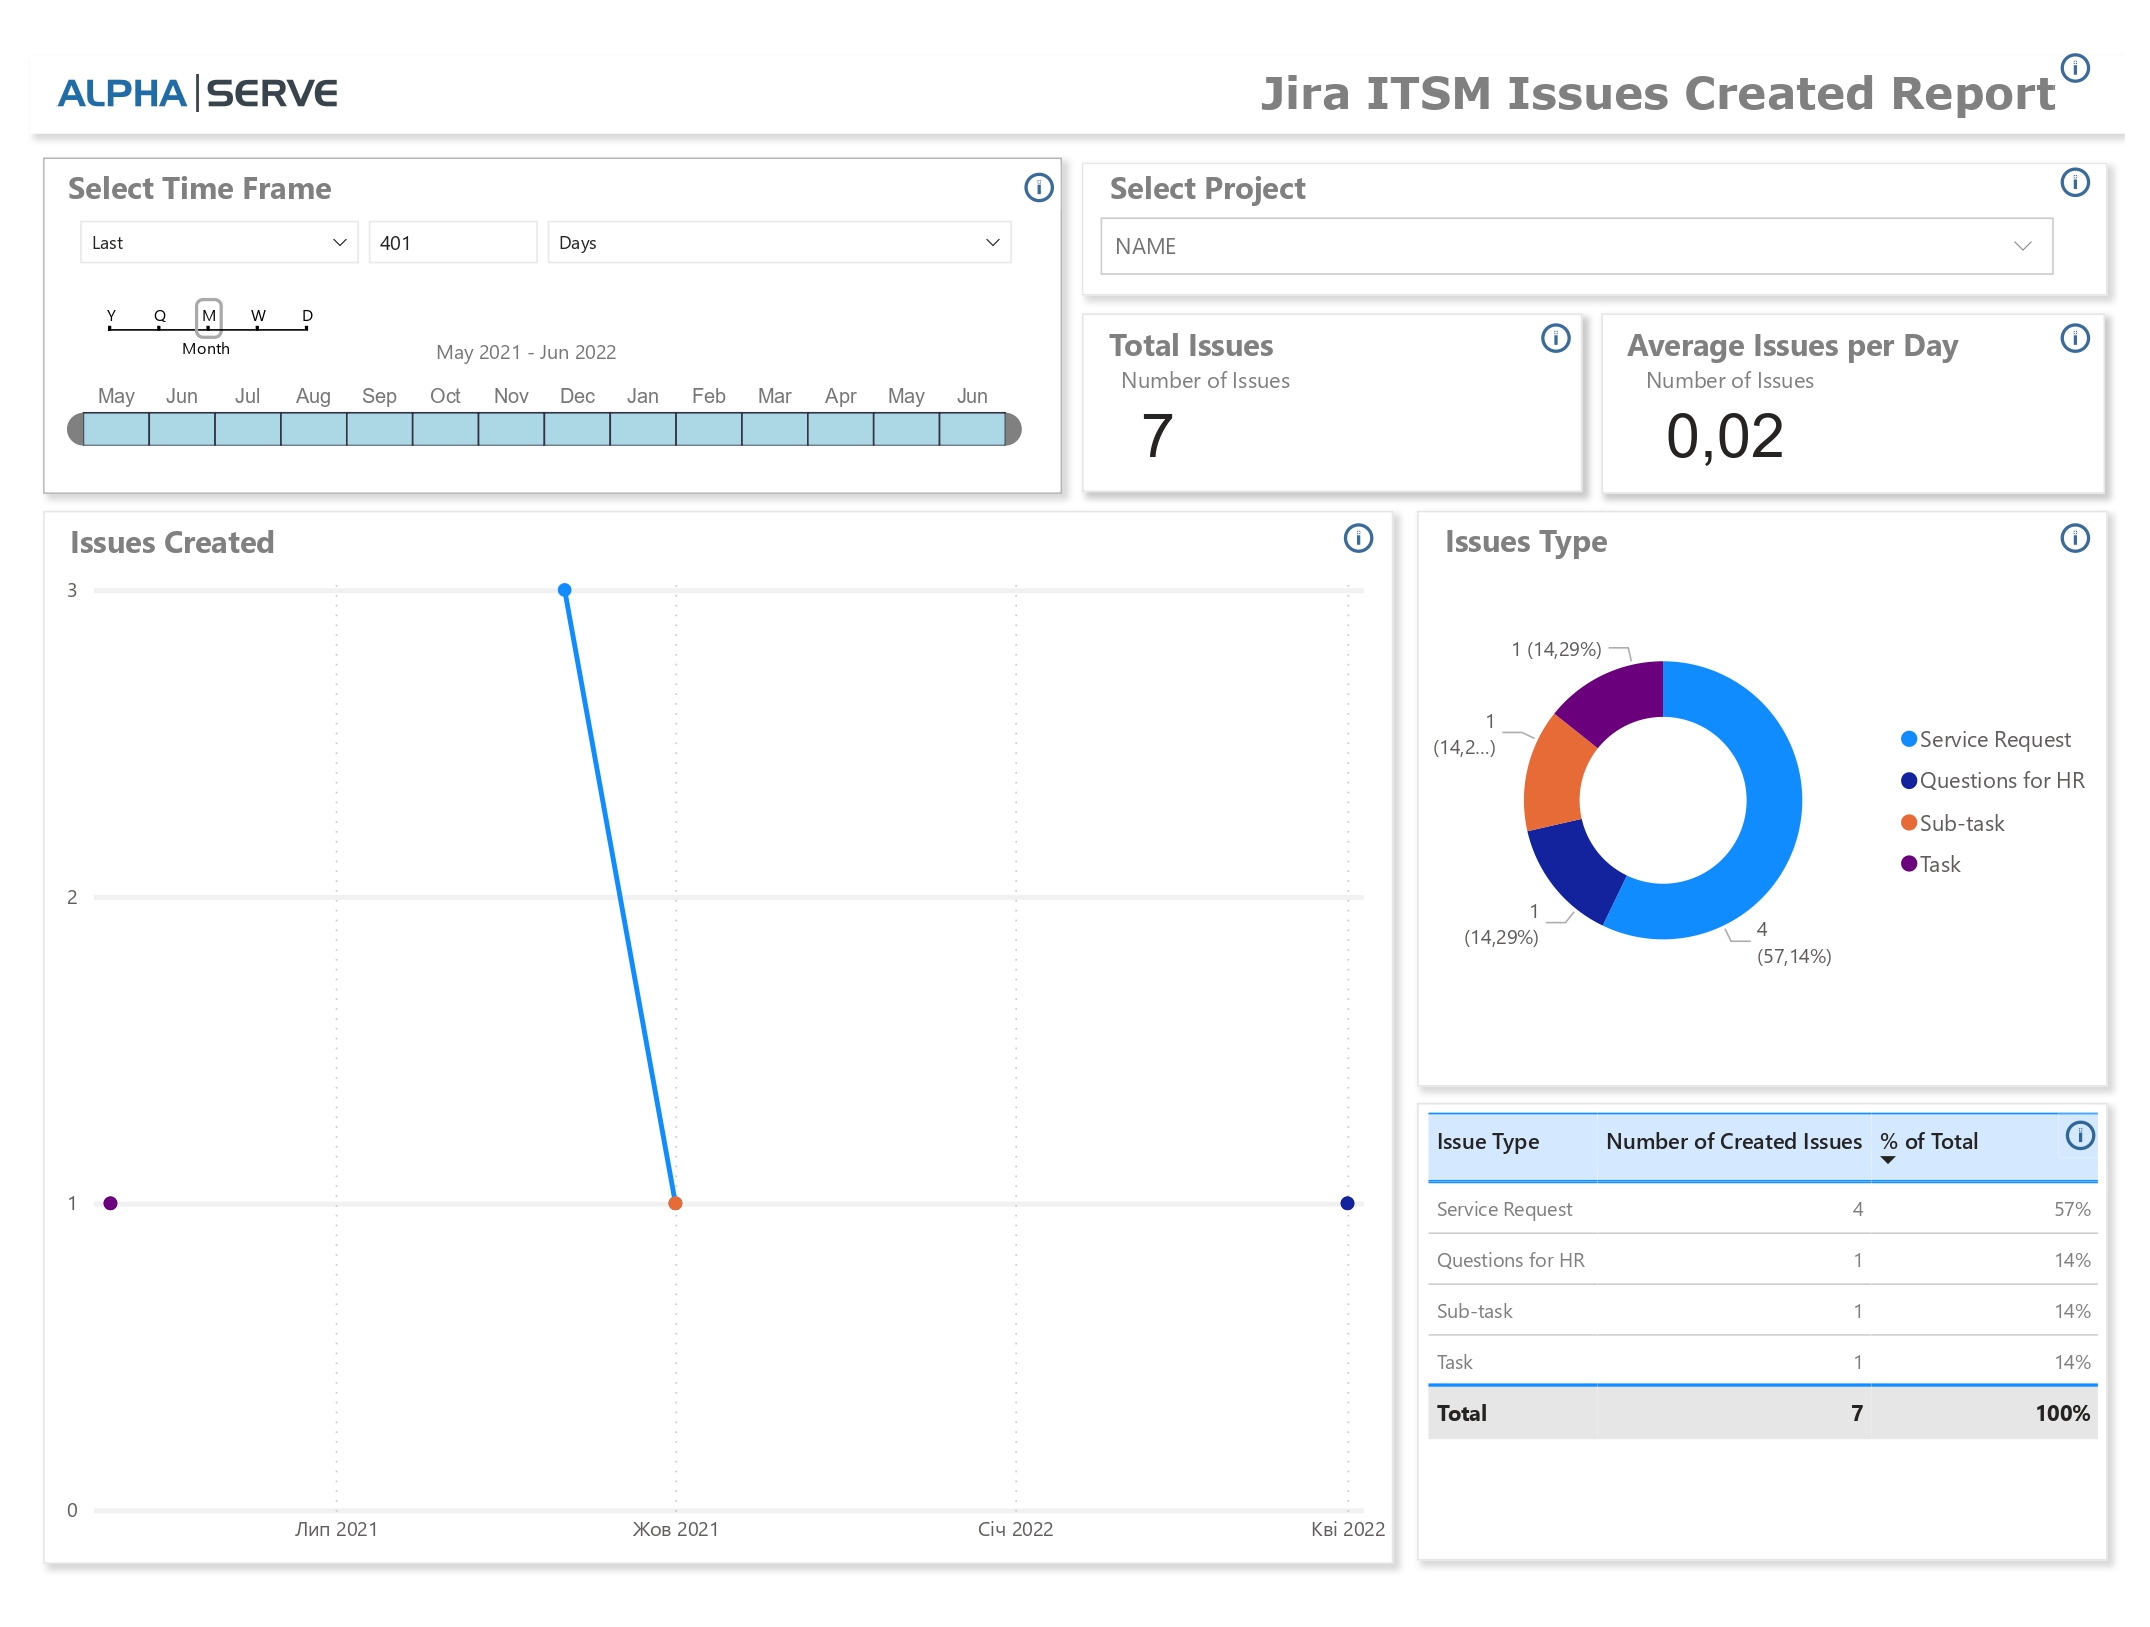
Jira ITSM Issues Created Report
Issues Created Report is one of the most widely used reports in Jira. It shows the full issues overview per certain project and period of time, the share of issues per type and/or priority. It is used by support teams to monitor workload as well as development quality based on users' requests.