All You can adjust all Tableau Connector for Jira settings can be made on one page, therefore the instructions below show how to find the plugin’s settings page and describe all available configurations.
Platform administrators always
have the ability to see any existing connectors in an instance
have the ability to modify any existing connectors in an instance
have the ability to delete any existing connectors in an instance
a single page. The instructions below will guide you in locating app settings page and provide an overview of all available configuration options.
| Info |
|---|
Platform administrators always have the ability to view, modify, delete, and edit the share settings of any existing connectors in an instance. |
| Table of Contents |
|---|
How to
find Tableau BI Connector for Jira settings page?You canGet to The Settings Page
There are 2 options for how to get to the application settings page in 2 possible ways:
1st option:
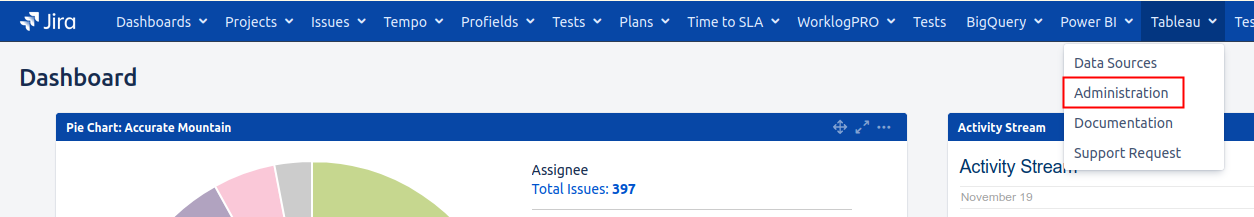
Click Tableau Tab on the Jira main menu. Then choose Administration.
2nd option:
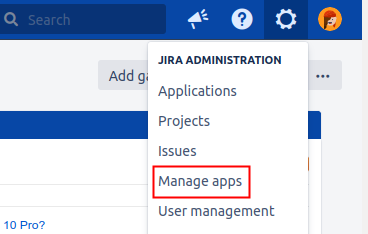
Step 1. Go to Jira Administration tab and select Manage app section.
Step 2. On the left side menu panel find “Tableau Connector for Jira” and click Plugin settings.
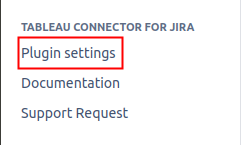
Tableau Connector for Jira settings page description
Below you will find a detailed description of Tableau Connector for Jira settings:
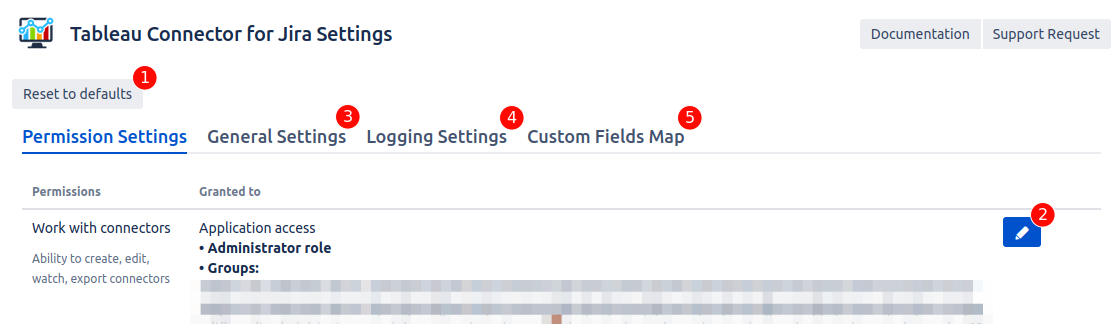
1. Reset to defaults.
This action will restore plugin settings to defaults, delete all Data Sources and user permissions.
2. Edit user permissions.
To be able to import data from Jira into Tableau Desktop Jira administrator should grant permission to create, edit, watch, and export connectors.
These settings grant users and groups permission.
Select groups - start typing to find and add relevant users group.
Select users - start typing to find and add relevant users.
Select project roles - start typing to find and add relevant users.
3. General Settings
Jira administrators have the ability:
Set a maximum number of tickets(Issues Limit) that can be exported at an instance level.
. Feel free to use the one that is more convenient for you.
Option 1
Being signed in to your Jira instance, select Tableau, and then select Administration.

| Info |
|---|
The Tableau Connector for Jira Settings page will appear. |

Option 2
Being signed in to your Jira instance, select ⚙️, and then select Manage apps.

Scroll down, look for TABLEAU CONNECTOR FOR JIRA, and then select Plugin settings.

| Info |
|---|
The Table Connector for Jira Settings page will appear. |
Setting Page Overview
Power BI Connector for Jira Settings page includes the following settings:
Permission Settings
General Settings
App Logging Settings
Export Logging Settings
Custom Fields Map
The page also has the Reset to defaults button.

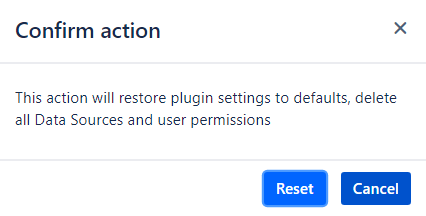
Reset to Defaults
Reset to defaults - This action will restore all app settings, delete all data sources and their settings, and delete all users permissions.
Once you select this button, the Reset to defaults pop-up window will appear.
Select Reset, if you do want to reset all settings and delete data sources.
Select Cancel, if you no longer want to do it.

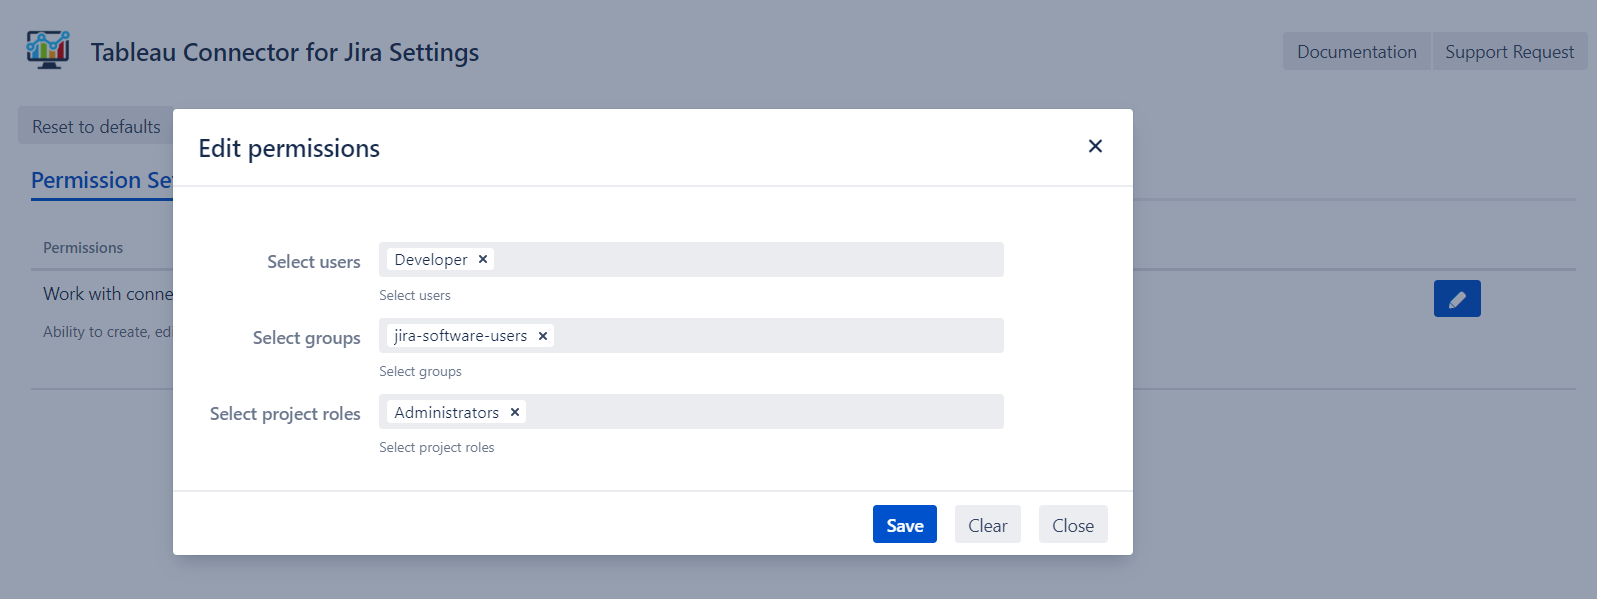
Permission Settings
Here Jira administrators can grant permissions to users to create, edit, view, and export connectors.

In the Users field, enter the username you want to grant permissions to.
| Info |
|---|
Once you start typing, the drop-down list with usernames suggestions will appear. Select the user from the list. Changes will be saved automatically. |

In the Groups field, enter the group name you want to grant permissions to.
| Info |
|---|
Once you start typing, the drop-down list with available groups will appear. Select group from the list. Changes will be saved automatically. |

In the Project Roles field, enter the role(s) you want to grant permissions to.
| Info |
|---|
Once you start typing, the drop-down list with the project roles you have inside your project will appear. Select roles from the list. Changes will be saved automatically. |

Select the Edit icon, if you want to make changes.
Select the Clear button, if you want to delete permissions.
| Note |
|---|
Selecting the Clear button, you will erase information from all fields: Users, Groups, and Project Roles. |

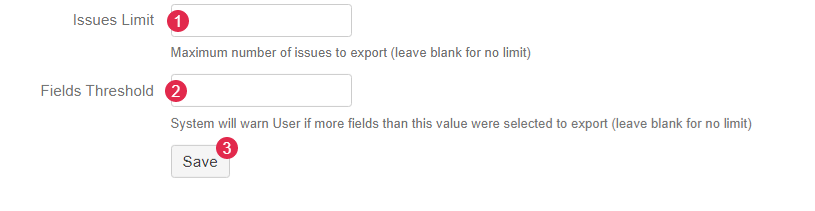
General Settings
The General Settings help to:
prevent misuse of the app
alleviate the significant strain on Jira
improve time to export

Issues Limit - This setting allows you to set a maximum number of tickets that can be exported at the instance level.
Fields Threshold - This settings allows you to set a maximum number of fields that can be exported without a warning message.
| Info |
|---|
All changes will be saved automatically. |
Save to apply settings
General Settings help to:
stop misuse of the addon
drop the considerable strain on JIRA
improve time to export
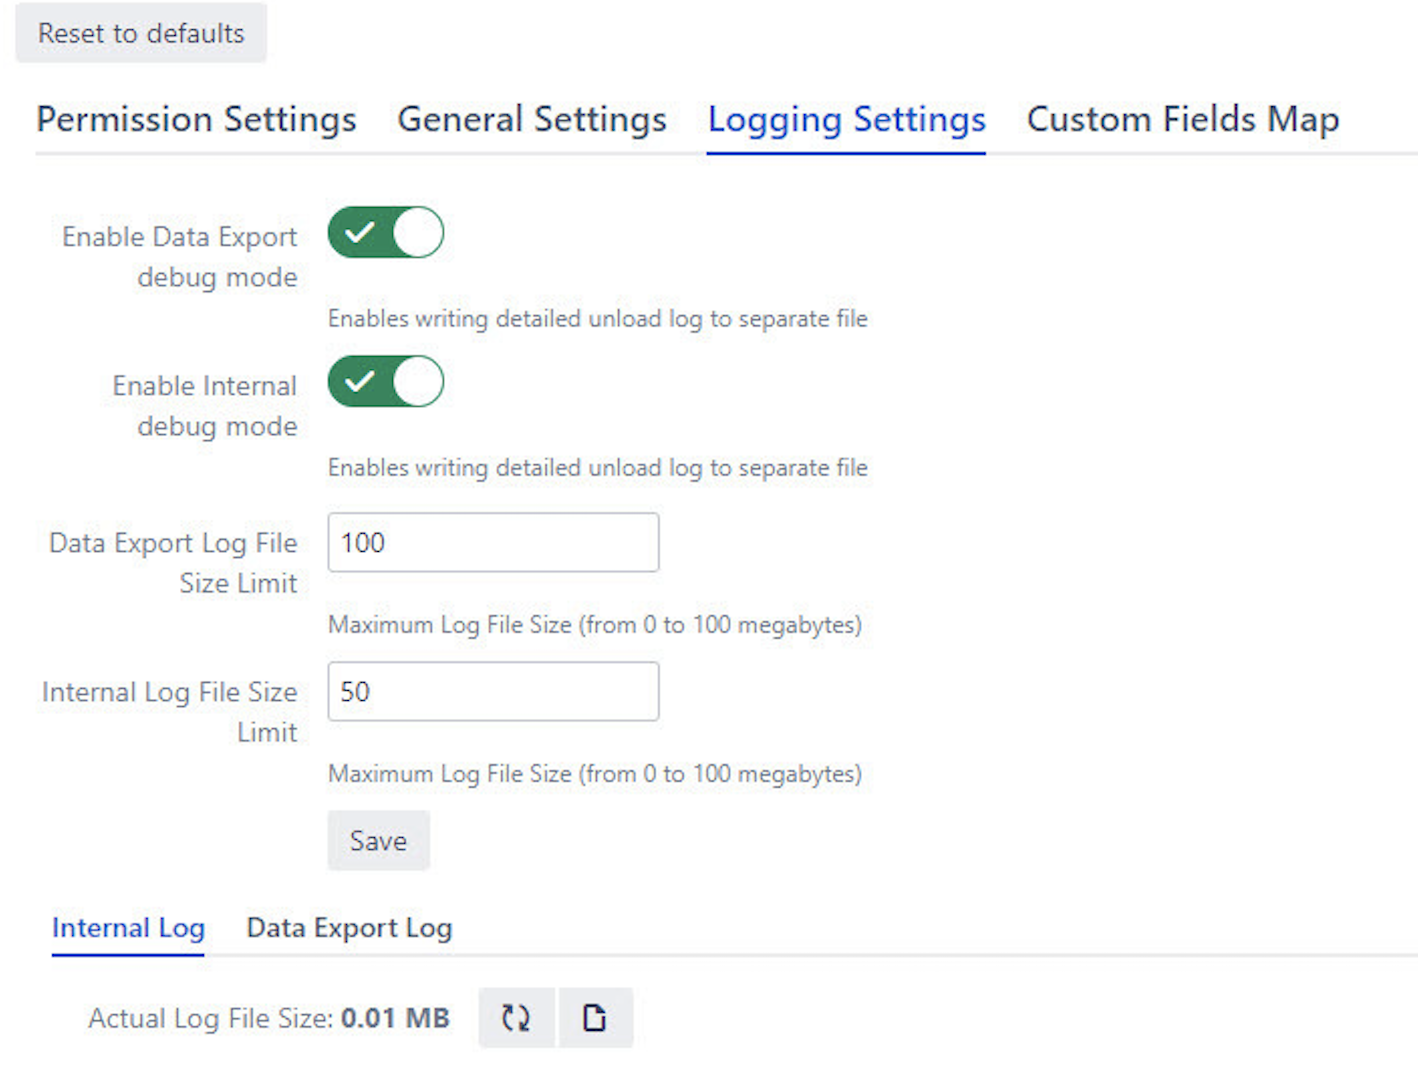
4. Logging Settings
A useful tool for debugging the plugin. It’s recommended to turn it on only for troubleshooting cases and to turn it off right after receiving enough data to analyze issues.
Enable/disable debug mode - toggle to turn it on and off (debug mode affects the performance of the instance, so it’s highly recommended to turn it off after getting all necessary debug info).
Enable/disable internal debug mode - toggle to turn on/off for logging all actions performed with data sources except data export (creating, editing, cloning, changing owner, etc.).
Log File Size Limit - Maximum log file size (from 0 to 100 megabytes).
Save to apply settings
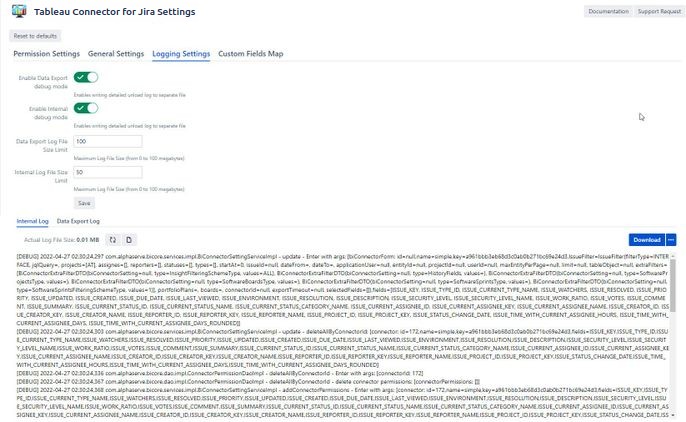
Refresh logs
Clear logs
Download logs so you can send them to the Tableau Connector for Jira support team
Select file format (Log or Zip)

In order to minimize debug mode’s impact on the instance, please follow these simple steps:
Create a data source with one selected table for analysis. It’s recommended to enable filtering to reduce data amount to export. See User Guide if you need detailed instructions on how to create a data source.
Go to Logging Settings.
Clear previous logs if any left, set a log file limit, save changes and enable debug mode.

App Logging Settings
App debug mode records all events related to data source, with the exception of data export, but including creating, editing, cloning, changing owner, etc. It is useful for troubleshooting problems or investigation incidents.
It’s recommended to keep the App debug mode turned on.
Here you can also set up maximum size of your log file.
| Info |
|---|
For example, you set a maximum of size 50 MB, once the log file reaches this limit, the older log events will be automatically deleted and the log recreated from scratch. |

Actual Log File Size - This field displays the current size of the log file.
The Refresh icon - This option allows you to refresh logs.
The Clear icon - This option allows you to manually delete logs.
Download Zip - This option allows you to download your log file in a compressed zip format.
Download Log - This option allows you to download your log file in its original format.

Export Logging Settings
Data Export debug mode records events related to data export.
It’s recommended to keep Data Export debug mode turned off as it can impact your instance performance.
Here you can also set up maximum size of your log file.

Actual Log File Size - This field displays the current size of the log file.
The Refresh icon - This option allows you to refresh logs.
The Clear icon - This option allows you to manually delete logs.
Download Zip - This option allows you to download your log file in a compressed zip format.
Download Log - This option allows you to download your log file in its original format.

How to Use Data Export Debug Mode
To minimize the impact of the data export debug mode on your instance, please follow the instructions on its usage.
Create a data source with selected table you’re experiencing issue with.
| Info |
|---|
Filter the data by selecting the project you’re experiencing issues with. Select only those tables and fields you need to be troubleshooted. |
Go back to Export Logging Settings, and then clear the previous logs, if there are any.
Set size limit of log file, and then enable Data Export debug mode.
Start exporting your data.
| Info |
|---|
If you need instruction on how to export your data source, please refer to our step-by-step instruction. |
After data export is completed,
open Export Logging Settings, disable Data Export debug mode, and then download the log file.
At the moment, the output of the following tables is being logged:
Jira Core | Jira Software | Service Management | Tempo | Insight | Xray | Tempo Budgets |
|---|---|---|---|---|---|---|
|
|
|
|
|
|
|
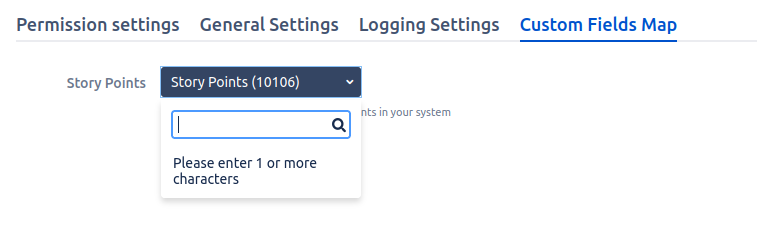
Custom Fields Map
Select Custom Field defined as Story Points in your system.